
Expert in building Interactive Dashboards & Insightful Reports

Starting at
$
200
About this service
Summary
What's included
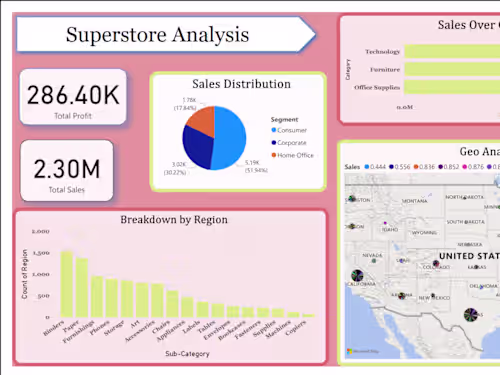
Interactive Dashboard
A fully customized, user-friendly dashboard created using Power BI, Tableau, or Google Data Studio. Designed to visualize key metrics, trends, and KPIs based on your business goals. Includes filters, slicers, and drill-down functionality for deeper analysis.
Summary Report
A concise, visual report that summarizes key findings, insights, and recommendations derived from the data. Delivered in PDF or presentation format, ideal for stakeholders and decision-makers.
Dataset Documentation
Detailed documentation outlining the structure of the dataset, data sources used, cleaning steps performed, and definitions of each column. Ensures transparency and ease of use for future reference or handover.
Duration
1 week
Skills and tools
Data Analyst
Data Scientist
Data Visualizer

Microsoft Excel

Microsoft Power BI

Python

SQL

Tableau
Industries