
Data AnalystHenkel Oktofery
Data collection, data preparation, data analysis, data visualization, and insights generation
What's included
Data collection, data preparation, data analysis, data visualization, and insights generation
Data Collection:
It contains details on the structure, format, and data source. The procedure for gathering, processing, and storing the data.
Data Preparation:
Data transformation and cleansing are steps in the process of preparing data for analysis.
Data Analysis:
Find patterns, trends, and insights, and a data analysis dashboard are the main outputs of this phase. The findings of the investigation using statistical methods are presented in a statistical analysis report.
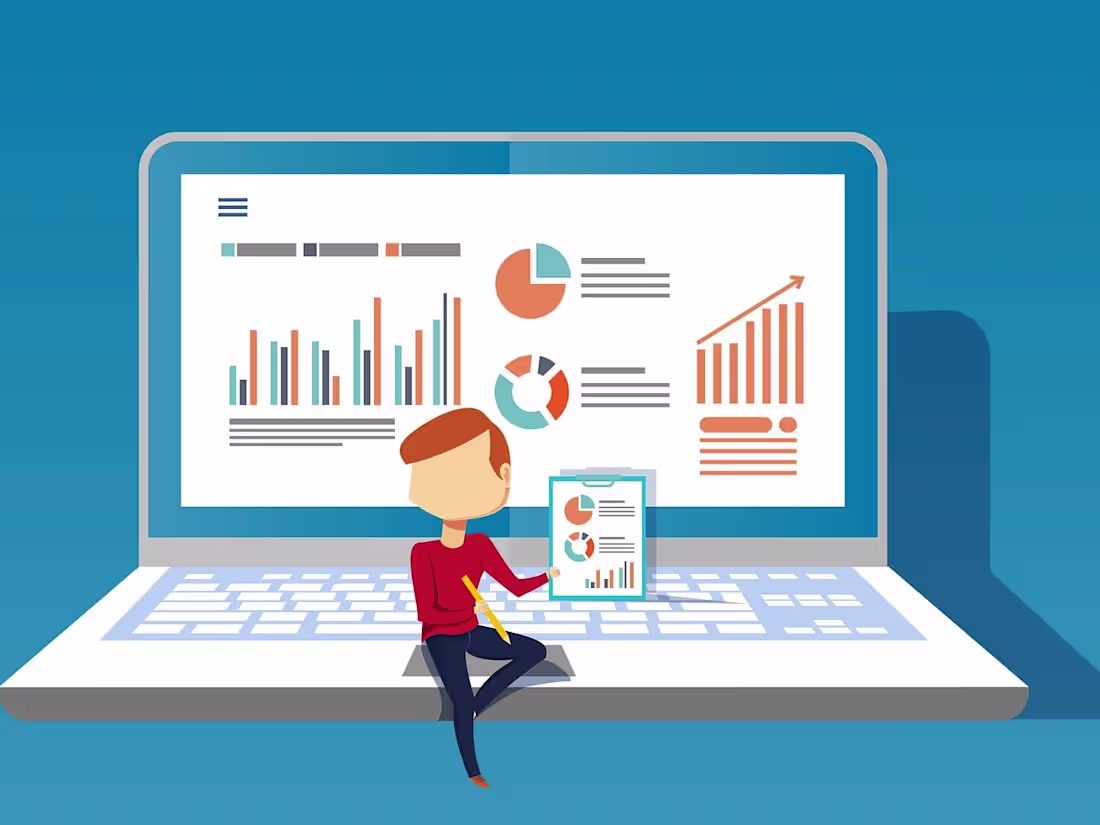
Data Visualization:
A data visualisation report displays the data using visuals like graphs or charts. A dashboard prototype gives stakeholders a functional version of the dashboard so they may offer input.
Insights Generation:
Drawing conclusions from the analysis and communicating them to the stakeholders are both involved. The steps that should be followed in light of the insights are described in a report with recommendations.
Henkel's other services
Contact for pricing
Tags
Microsoft Excel
Microsoft Power BI
pandas
SQL
Tableau
Data Analyst
Data Modelling Analyst
Service provided by
Henkel Oktofery Batam, Indonesia
Data AnalystHenkel Oktofery
Contact for pricing
Tags
Microsoft Excel
Microsoft Power BI
pandas
SQL
Tableau
Data Analyst
Data Modelling Analyst
Data collection, data preparation, data analysis, data visualization, and insights generation
What's included
Data collection, data preparation, data analysis, data visualization, and insights generation
Data Collection:
It contains details on the structure, format, and data source. The procedure for gathering, processing, and storing the data.
Data Preparation:
Data transformation and cleansing are steps in the process of preparing data for analysis.
Data Analysis:
Find patterns, trends, and insights, and a data analysis dashboard are the main outputs of this phase. The findings of the investigation using statistical methods are presented in a statistical analysis report.
Data Visualization:
A data visualisation report displays the data using visuals like graphs or charts. A dashboard prototype gives stakeholders a functional version of the dashboard so they may offer input.
Insights Generation:
Drawing conclusions from the analysis and communicating them to the stakeholders are both involved. The steps that should be followed in light of the insights are described in a report with recommendations.
Henkel's other services
Contact for pricing