
Transforming complex data into attractive reports and dashbaordsPankaj Kumar
I will offer you a attractive data visualization experience, delivering:
Data Clarity: Uncover hidden patterns, trends, and correlations within your data, presented in a clear and actionable format.
Visual Storytelling: Our expert team crafts compelling narratives, transforming complex data into engaging visual stories that drive insights and decision-making.
Personalized Approach: Tailored solutions designed to meet your specific business needs, goals, and challenges.
Data-Driven Impact: Empower your organization to make informed, strategic decisions, driving growth, and success.
Collaborative Partnership: Work closely with our team to ensure seamless integration, knowledge transfer, and ongoing support.
Cutting-Edge Expertise: Leverage the latest data visualization tools, technologies, and best practices to stay ahead of the curve.
Measurable Results: Quantifiable insights and recommendations, enabling you to track progress, measure success, and refine strategies.
You'll gain a deeper understanding of your data, make informed decisions, and drive business success with confidence.
What's included
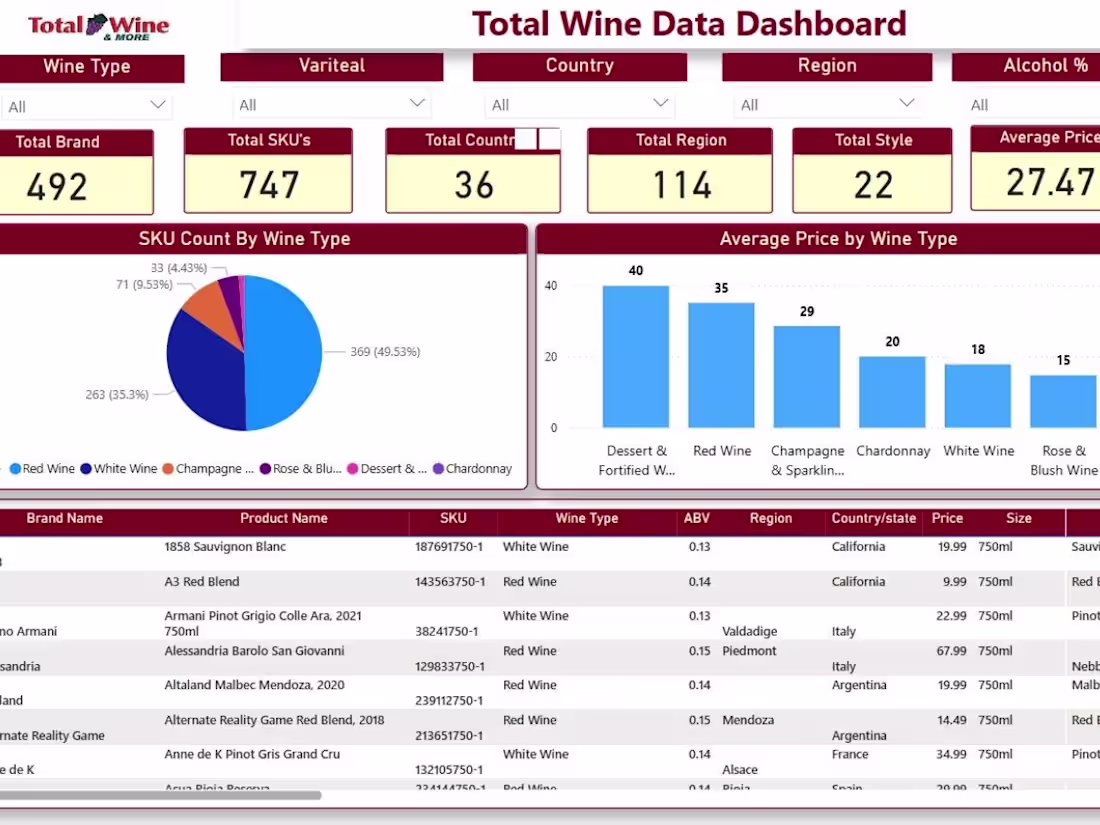
Customized Data Visualization Dashboard:
Interactive and dynamic dashboard tailored to client's specific needs
Incorporating key performance indicators (KPIs), metrics, and data visualizations
Data Storyboard:
A visual narrative presenting key findings, insights, and recommendations
Highlighting trends, patterns, and correlations within the data
Interactive Reports:
Detailed, interactive reports providing in-depth analysis and insights
Featuring data visualizations, charts, and tables
Data Visualization Guidelines:
A comprehensive guide outlining best practices for data visualization
Ensuring consistency and effectiveness in future data visualization efforts
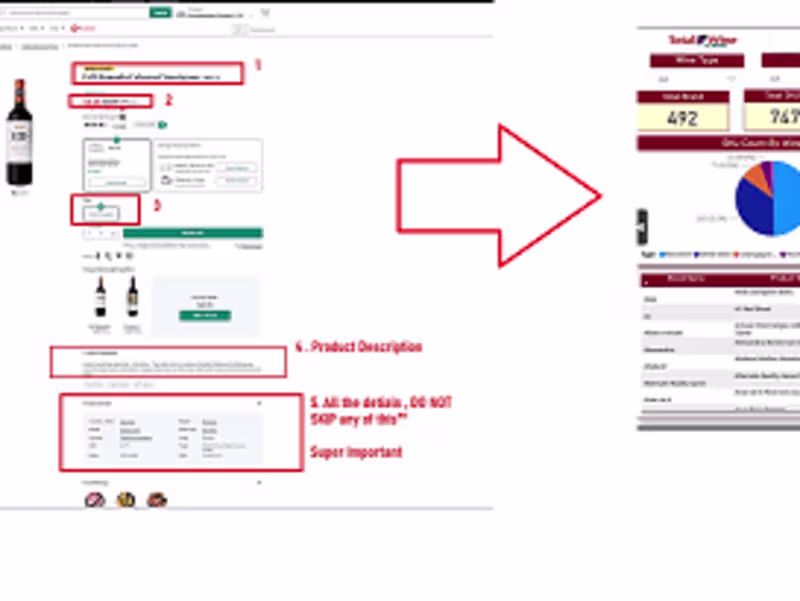
Data Preparation and Cleaning:
Cleaned, transformed, and formatted data for seamless integration
Ensuring data quality and accuracy
Training and Support:
Comprehensive training on using and interpreting the dashboard and reports
Ongoing support for any questions or concerns
Example work


Pankaj's other services
Starting at$10
Duration1 week
Tags
CoPilot
Microsoft Power BI
Power Apps
SQL
Data Analyst
Data Scientist
Data Visualizer
Service provided by
Pankaj Kumar Bengaluru, India
Transforming complex data into attractive reports and dashbaordsPankaj Kumar
Starting at$10
Duration1 week
Tags
CoPilot
Microsoft Power BI
Power Apps
SQL
Data Analyst
Data Scientist
Data Visualizer
I will offer you a attractive data visualization experience, delivering:
Data Clarity: Uncover hidden patterns, trends, and correlations within your data, presented in a clear and actionable format.
Visual Storytelling: Our expert team crafts compelling narratives, transforming complex data into engaging visual stories that drive insights and decision-making.
Personalized Approach: Tailored solutions designed to meet your specific business needs, goals, and challenges.
Data-Driven Impact: Empower your organization to make informed, strategic decisions, driving growth, and success.
Collaborative Partnership: Work closely with our team to ensure seamless integration, knowledge transfer, and ongoing support.
Cutting-Edge Expertise: Leverage the latest data visualization tools, technologies, and best practices to stay ahead of the curve.
Measurable Results: Quantifiable insights and recommendations, enabling you to track progress, measure success, and refine strategies.
You'll gain a deeper understanding of your data, make informed decisions, and drive business success with confidence.
What's included
Customized Data Visualization Dashboard:
Interactive and dynamic dashboard tailored to client's specific needs
Incorporating key performance indicators (KPIs), metrics, and data visualizations
Data Storyboard:
A visual narrative presenting key findings, insights, and recommendations
Highlighting trends, patterns, and correlations within the data
Interactive Reports:
Detailed, interactive reports providing in-depth analysis and insights
Featuring data visualizations, charts, and tables
Data Visualization Guidelines:
A comprehensive guide outlining best practices for data visualization
Ensuring consistency and effectiveness in future data visualization efforts
Data Preparation and Cleaning:
Cleaned, transformed, and formatted data for seamless integration
Ensuring data quality and accuracy
Training and Support:
Comprehensive training on using and interpreting the dashboard and reports
Ongoing support for any questions or concerns
Example work
Pankaj's other services
$10