
Data Analysis and VisualizationRyker Bickmore
Data visualization empowers businesses by transforming raw data into interactive dashboards and visualizations, making it easier to understand trends and patterns. By presenting complex information in a clear, visual format, it enables decision-makers to stay informed and quickly identify opportunities or challenges. This streamlined access to data-driven insights allows businesses to make strategic decisions with confidence, ensuring they remain agile and ahead in a competitive landscape.
What's included
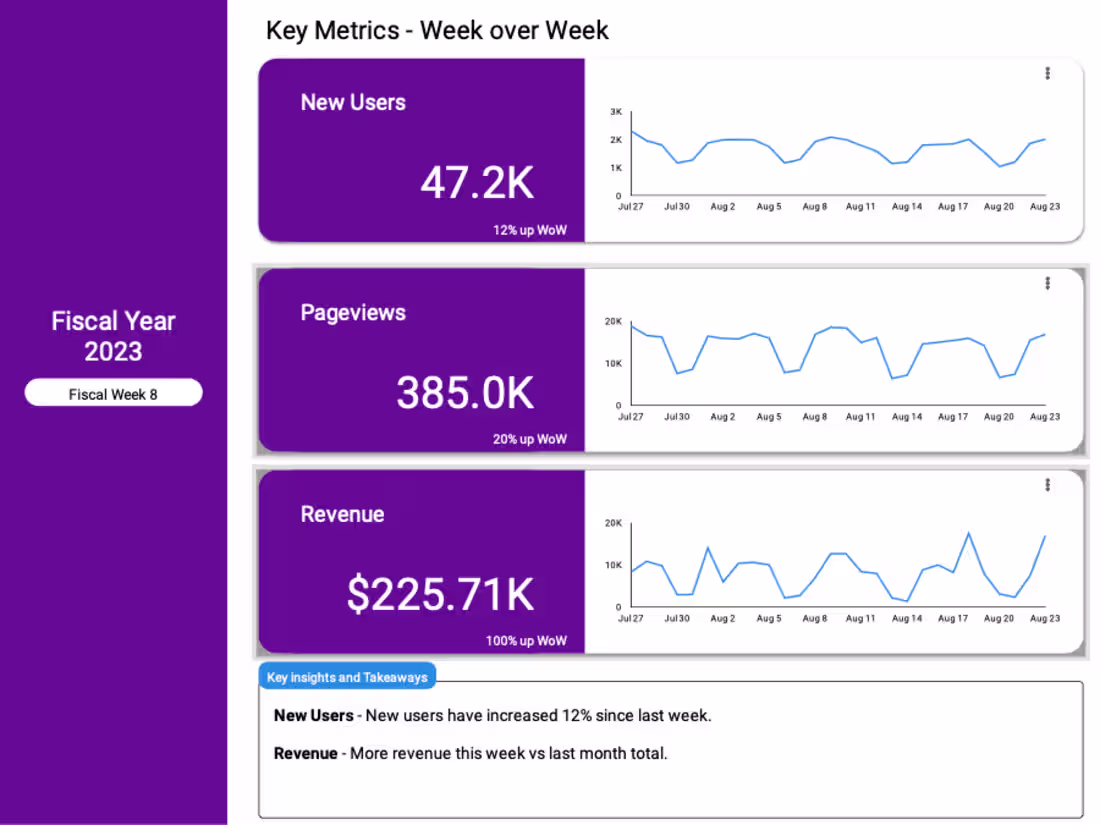
Dashboard report for any business
A informative dashboard showing your most important KPIs.
Starting at$100 /hr
Tags
Google Analytics
Google BigQuery
Google Tag Manager
Looker Studio
Python
Business Analyst
Data Analyst
Data Visualizer
Service provided by
Ryker Bickmore Blacksburg, USA
- 1
- Followers
Data Analysis and VisualizationRyker Bickmore
Starting at$100 /hr
Tags
Google Analytics
Google BigQuery
Google Tag Manager
Looker Studio
Python
Business Analyst
Data Analyst
Data Visualizer
Data visualization empowers businesses by transforming raw data into interactive dashboards and visualizations, making it easier to understand trends and patterns. By presenting complex information in a clear, visual format, it enables decision-makers to stay informed and quickly identify opportunities or challenges. This streamlined access to data-driven insights allows businesses to make strategic decisions with confidence, ensuring they remain agile and ahead in a competitive landscape.
What's included
Dashboard report for any business
A informative dashboard showing your most important KPIs.
$100 /hr