
Excel Financial Dashboard CreationStanly Luis Reyes
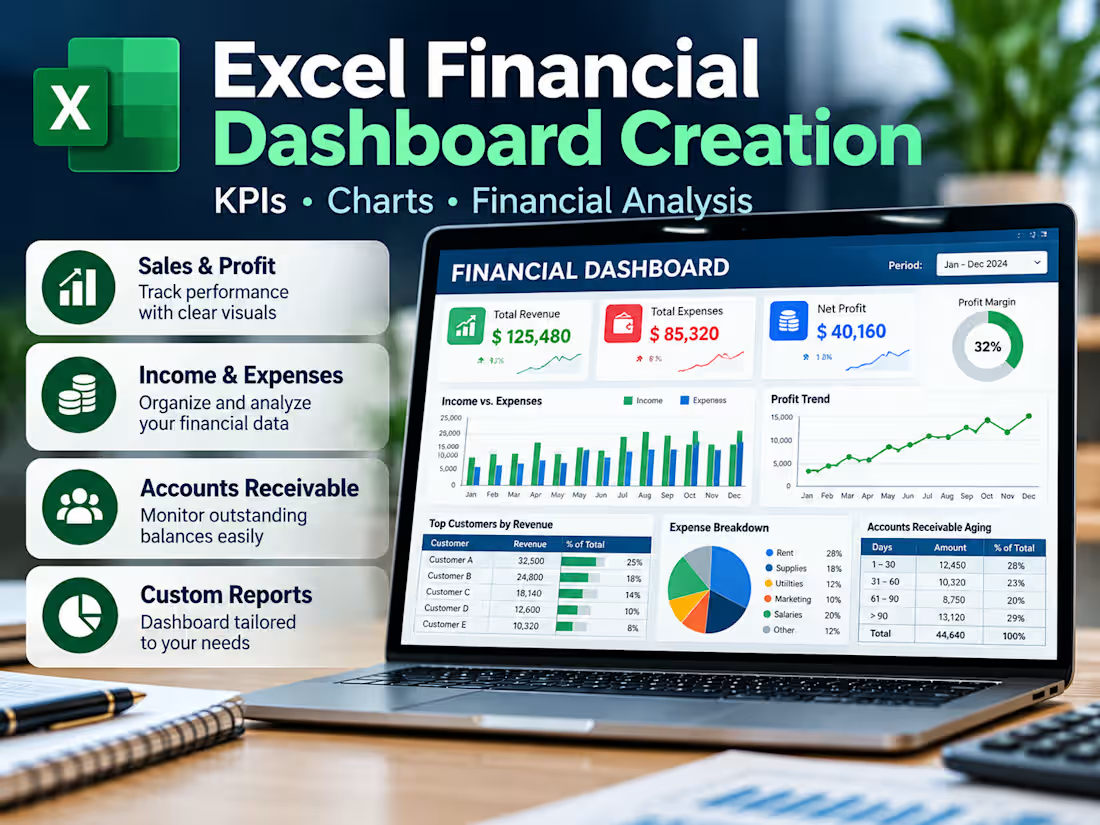
I create professional Excel dashboards that help businesses organize financial information, monitor performance, and make better decisions.
What I can create for you:
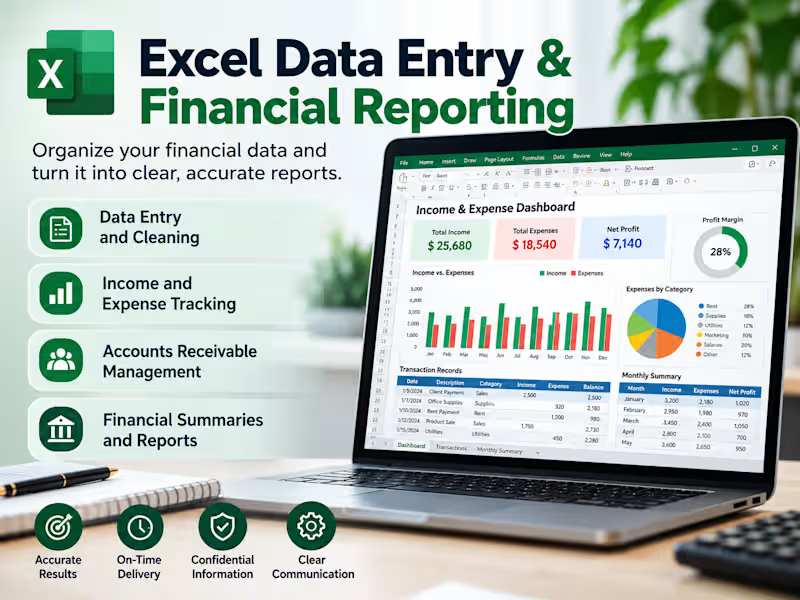
Income and expense dashboards.
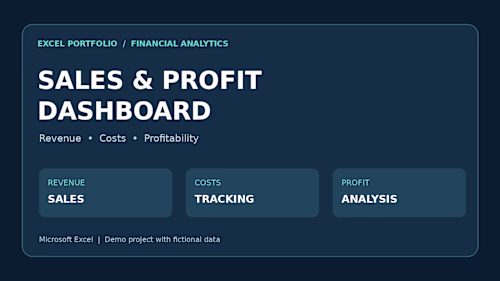
Sales and profit reports.
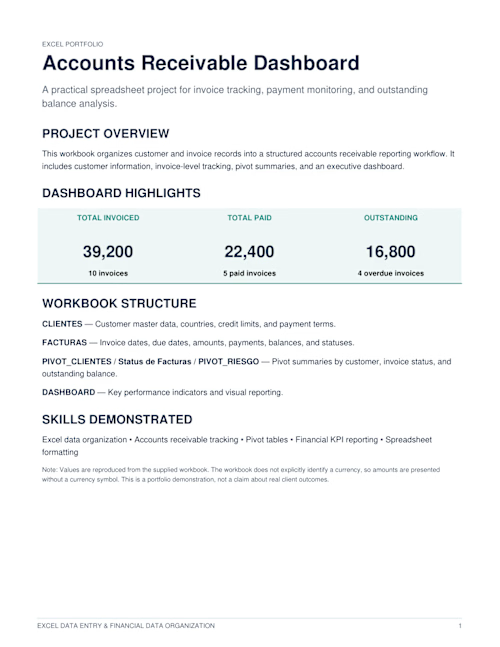
Accounts receivable summaries.
Financial KPI tracking.
Interactive Excel charts and PivotTables.
Automated calculations using Excel formulas.
What's included in the $125 package:
One professional Excel dashboard.
Up to 500 rows of client-provided data.
Up to 5 key performance indicators (KPIs).
Up to 3 charts.
One organized data sheet.
Basic formulas and data formatting.
Two revisions.
Delivery within 7 days.
My Process:
Review your data and project requirements.
Clean and organize your Excel information.
Build the dashboard and financial indicators.
Test calculations and review the results.
Deliver the completed Excel workbook.
Why work with me?
I have professional experience in revenue analysis, accounting processes, payment tracking, and financial reporting.
I focus on accuracy, clear presentation, and organized financial information.
What I need from you:
Your Excel or CSV data.
The KPIs or metrics you want to track.
Any preferred colors or reporting format.
Please contact me before ordering to confirm your requirements.
Advanced automation, VBA macros, complex financial models, and large datasets are not included in the standard package and require a custom quote
FAQs
Stanly's other services
Starting at$125
Duration1 week
Tags
Microsoft Excel

Accountant
Data Analyst
Financial Analyst
Service provided by
Stanly Luis Reyes Santo Domingo, Dominican Republic
Excel Financial Dashboard CreationStanly Luis Reyes
Starting at$125
Duration1 week
Tags
Microsoft Excel
Accountant
Data Analyst
Financial Analyst
I create professional Excel dashboards that help businesses organize financial information, monitor performance, and make better decisions.
What I can create for you:
Income and expense dashboards.
Sales and profit reports.
Accounts receivable summaries.
Financial KPI tracking.
Interactive Excel charts and PivotTables.
Automated calculations using Excel formulas.
What's included in the $125 package:
One professional Excel dashboard.
Up to 500 rows of client-provided data.
Up to 5 key performance indicators (KPIs).
Up to 3 charts.
One organized data sheet.
Basic formulas and data formatting.
Two revisions.
Delivery within 7 days.
My Process:
Review your data and project requirements.
Clean and organize your Excel information.
Build the dashboard and financial indicators.
Test calculations and review the results.
Deliver the completed Excel workbook.
Why work with me?
I have professional experience in revenue analysis, accounting processes, payment tracking, and financial reporting.
I focus on accuracy, clear presentation, and organized financial information.
What I need from you:
Your Excel or CSV data.
The KPIs or metrics you want to track.
Any preferred colors or reporting format.
Please contact me before ordering to confirm your requirements.
Advanced automation, VBA macros, complex financial models, and large datasets are not included in the standard package and require a custom quote
FAQs
Stanly's other services
$125