
EDA, Visualization, and Insights with PythonSadidul Kabir
I provide thorough data analysis services that are customized to your unique requirements and make use of cutting-edge methods and industry-standard tools like Python, Seaborn, Matplotlib, NumPy, scikit-learn, and Pandas.
What's included
Data Cleaning
First, import the dataset. Then, identify and handle missing values effectively. Explore the dataset's shape, information, and spot duplicates. Conduct a garbage check to maintain data integrity.
Exploratory Data Analysis (EDA)
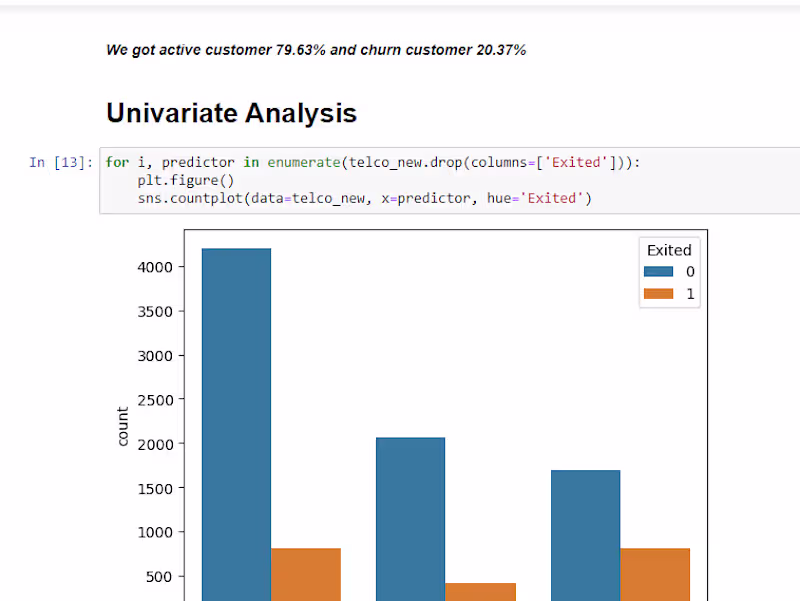
Dive into descriptive statistics for a deeper understanding of your data. Visualize data distributions with histograms and box plots. Uncover patterns and relationships with scatter plots and correlation heatmaps. Outliers treatment.
Find the insights and create a report
Through EDA, I take out the insights from the data as per your requirements. Then make a report with visualization and insights.
Sadidul 's other services
Starting at$10 /hr
Tags
pandas
scikit-learn
seaborn
Tableau
Data Analyst
Data Scientist
Data Visualizer
Service provided by
Sadidul Kabir Bangladesh
- 2
- Followers
EDA, Visualization, and Insights with PythonSadidul Kabir
Starting at$10 /hr
Tags
pandas
scikit-learn
seaborn
Tableau
Data Analyst
Data Scientist
Data Visualizer
I provide thorough data analysis services that are customized to your unique requirements and make use of cutting-edge methods and industry-standard tools like Python, Seaborn, Matplotlib, NumPy, scikit-learn, and Pandas.
What's included
Data Cleaning
First, import the dataset. Then, identify and handle missing values effectively. Explore the dataset's shape, information, and spot duplicates. Conduct a garbage check to maintain data integrity.
Exploratory Data Analysis (EDA)
Dive into descriptive statistics for a deeper understanding of your data. Visualize data distributions with histograms and box plots. Uncover patterns and relationships with scatter plots and correlation heatmaps. Outliers treatment.
Find the insights and create a report
Through EDA, I take out the insights from the data as per your requirements. Then make a report with visualization and insights.
Sadidul 's other services
$10 /hr