
Financial data analysis & reporting for small businessesKeila Olaverria
Financial data analysis & reporting for small businesses
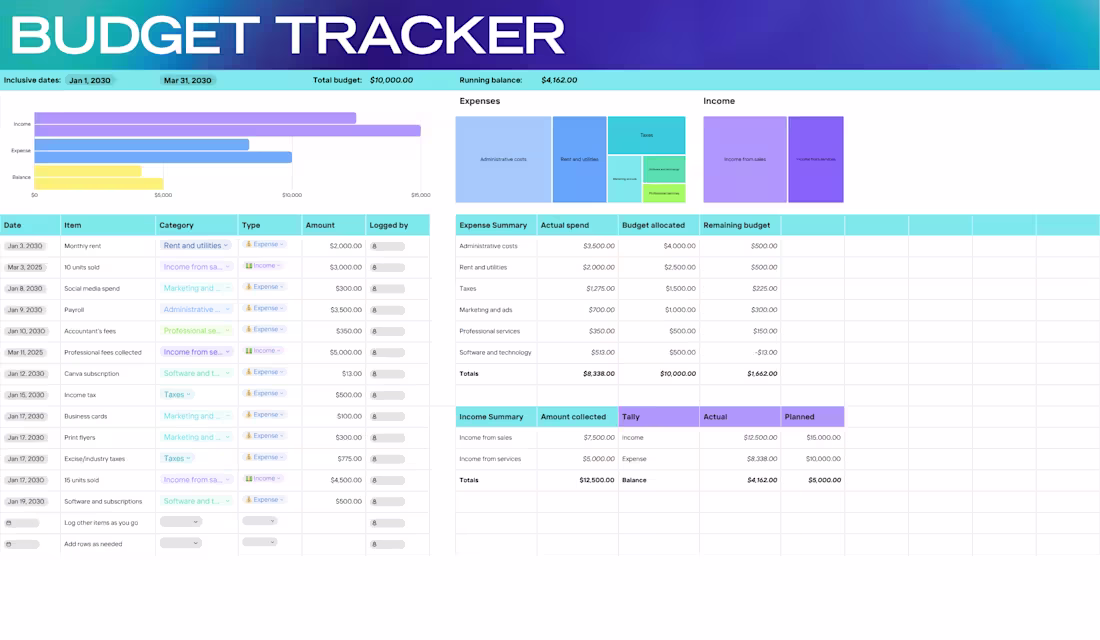
I’ll review your existing financial data (accounting/POS exports, bank or card statements, spreadsheets) and turn it into clear, easy‑to‑understand analysis and reports tailored to your business.
This service typically includes:
Cleaning and organizing your data (Excel/CSV) by date, category, product/service, or location.
Analyzing revenue, expenses, and profit trends over your chosen period (usually 6–12 months).
Highlighting your top income sources and biggest cost drivers.
Creating a simple Excel or Google Sheets report with summary tables and key charts.
Providing a short written summary with key findings and practical recommendations.
FAQs
Starting at$200
Duration1 week
Tags
Google Sheets
Microsoft Excel
Data Analyst
Financial Analyst
business analytics
* dashboards *
reporting
small business
Service provided by
Keila Olaverria Framingham, USA
Financial data analysis & reporting for small businessesKeila Olaverria
Starting at$200
Duration1 week
Tags
Google Sheets
Microsoft Excel
Data Analyst
Financial Analyst
business analytics
* dashboards *
reporting
small business
Financial data analysis & reporting for small businesses
I’ll review your existing financial data (accounting/POS exports, bank or card statements, spreadsheets) and turn it into clear, easy‑to‑understand analysis and reports tailored to your business.
This service typically includes:
Cleaning and organizing your data (Excel/CSV) by date, category, product/service, or location.
Analyzing revenue, expenses, and profit trends over your chosen period (usually 6–12 months).
Highlighting your top income sources and biggest cost drivers.
Creating a simple Excel or Google Sheets report with summary tables and key charts.
Providing a short written summary with key findings and practical recommendations.
FAQs
$200