
Dashboard UI UX DesignS M Naymur Rahman Nabil
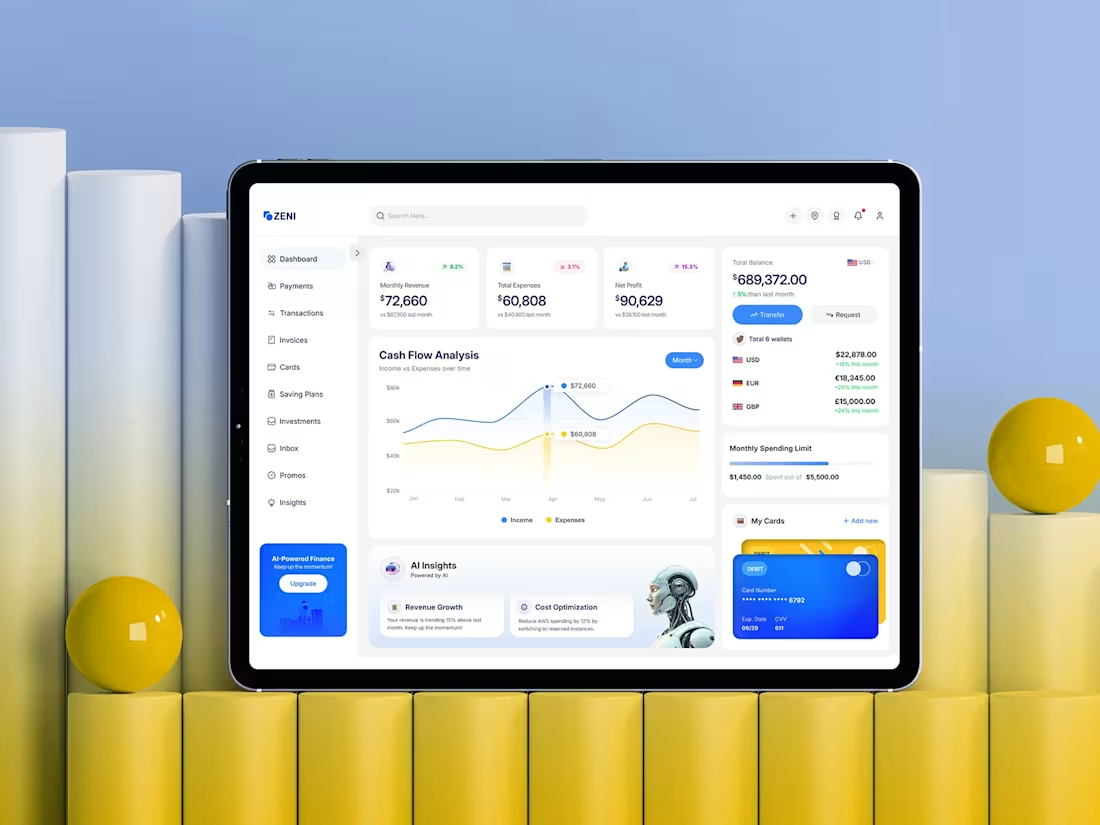
I design dashboards that transform raw data into structured, decision-driven interfaces. Whether for SaaS platforms, enterprise systems, analytics tools, CRM products, or admin panels, my focus is clarity, hierarchy, and workflow efficiency.
My process ensures that every data block, KPI, chart, filter, and interaction element has a defined purpose. The result is a scalable, component-based dashboard system that supports both immediate usability and long-term product growth.
What You Will Receive
You will receive a complete dashboard UI/UX package including user role mapping, workflow structuring, data hierarchy planning, and low-fidelity wireframes. High-fidelity dashboard interfaces will be designed in Figma with clearly defined components such as cards, tables, charts, filters, navigation systems, and state variations.
The project includes a scalable component-based design system, reusable dashboard modules, and a structured layout grid to support future expansion. An interactive prototype will demonstrate key user journeys, filter behavior, navigation logic, and dynamic states.
Final files will be organized for smooth developer handoff with clean naming conventions, reusable components, spacing systems, and export-ready assets.
Tools I will Use
Figma for interface design, component systems, and prototyping
Slack or email for structured communication
Google Meet or Zoom for project alignment
Organized feedback tracking throughout the design lifecycle
Typical Timeline
Most dashboard design projects are completed within 2 to 5 weeks depending on complexity, number of user roles, and volume of data modules required.
FAQs
Example work
S M Naymur's other services

Starting at$2,500
Duration2 weeks
Tags
Figma
UI Designer
UX Designer
dashboard design
SaaS Product Design
Service provided by
S M Naymur Rahman Nabil proDhaka, Bangladesh
- 1
- Paid projects
- 1
- Followers
Dashboard UI UX DesignS M Naymur Rahman Nabil
Starting at$2,500
Duration2 weeks
Tags
Figma
UI Designer
UX Designer
dashboard design
SaaS Product Design
I design dashboards that transform raw data into structured, decision-driven interfaces. Whether for SaaS platforms, enterprise systems, analytics tools, CRM products, or admin panels, my focus is clarity, hierarchy, and workflow efficiency.
My process ensures that every data block, KPI, chart, filter, and interaction element has a defined purpose. The result is a scalable, component-based dashboard system that supports both immediate usability and long-term product growth.
What You Will Receive
You will receive a complete dashboard UI/UX package including user role mapping, workflow structuring, data hierarchy planning, and low-fidelity wireframes. High-fidelity dashboard interfaces will be designed in Figma with clearly defined components such as cards, tables, charts, filters, navigation systems, and state variations.
The project includes a scalable component-based design system, reusable dashboard modules, and a structured layout grid to support future expansion. An interactive prototype will demonstrate key user journeys, filter behavior, navigation logic, and dynamic states.
Final files will be organized for smooth developer handoff with clean naming conventions, reusable components, spacing systems, and export-ready assets.
Tools I will Use
Figma for interface design, component systems, and prototyping
Slack or email for structured communication
Google Meet or Zoom for project alignment
Organized feedback tracking throughout the design lifecycle
Typical Timeline
Most dashboard design projects are completed within 2 to 5 weeks depending on complexity, number of user roles, and volume of data modules required.
FAQs
Example work
S M Naymur's other services
$2,500