
Data VisualizationIrfan Shah
As a data visualization service provider, our primary goal is to help clients transform their raw data into visually compelling and actionable insights that drive business value. We work with clients across various industries, including healthcare, finance, marketing, and more, to help them make sense of their data and communicate it effectively to their stakeholders.
Our service includes:
Consultation: We work closely with clients to understand their unique data needs and the objectives they want to achieve through data visualization. We help them identify the most relevant data sources and develop a customized approach to data visualization that meets their specific requirements.
Data Preparation and Cleaning: We prepare and clean the data to ensure that it is accurate, complete, and in a format that is suitable for visualization. We also perform exploratory data analysis to identify patterns and insights that can inform the design of the visualizations.
Visualization Design: We use a variety of tools and techniques to create visually compelling and interactive data visualizations that effectively communicate insights to the audience. We pay attention to the details of the visualization, such as color, layout, and typography, to make sure that the message is clear and understandable.
Iteration and Feedback: We work closely with the client to iterate and refine the visualizations based on their feedback. We use an agile development approach that allows us to quickly make changes and adjustments to the visualization based on the client's needs.
Delivery and Training: Once the visualizations are complete, we deliver them to the client in a format that is easily accessible and shareable. We also provide training and support to help clients understand how to use the visualizations effectively and how to interpret the insights.
Overall, our data visualization service is designed to help clients make sense of their data and communicate it effectively to their stakeholders. Our team of data experts and visualization designers work closely with clients to develop customized solutions that meet their specific needs and objectives.
What's included
Interactive dashboards and reports
These are customized dashboards and reports that allow the client to view and analyze the data in a user-friendly and easily digestible format. These reports can be shared with team members, stakeholders, or clients as needed.
Documentation and user manuals
Depending on the scope of work, we may provide documentation and user manuals that describe how the dashboards, reports, and data models were developed and how they can be used.
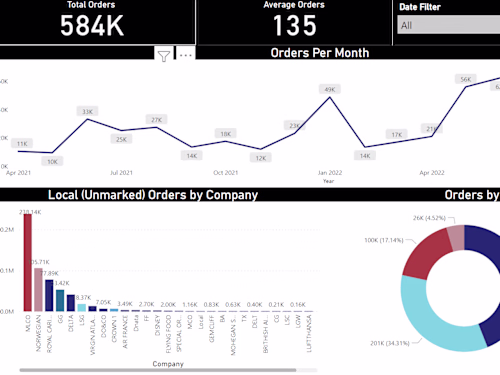
Example work
Irfan's other services

Starting at$100
Tags
Microsoft Excel
Microsoft Power BI
Python
Tableau
Data Analyst
Data Scientist
Data Visualizer
Service provided by
Irfan Shah Khyber Pakhtunkhwa, Pakistan
- 1
- Followers
Data VisualizationIrfan Shah
Starting at$100
Tags
Microsoft Excel
Microsoft Power BI
Python
Tableau
Data Analyst
Data Scientist
Data Visualizer
As a data visualization service provider, our primary goal is to help clients transform their raw data into visually compelling and actionable insights that drive business value. We work with clients across various industries, including healthcare, finance, marketing, and more, to help them make sense of their data and communicate it effectively to their stakeholders.
Our service includes:
Consultation: We work closely with clients to understand their unique data needs and the objectives they want to achieve through data visualization. We help them identify the most relevant data sources and develop a customized approach to data visualization that meets their specific requirements.
Data Preparation and Cleaning: We prepare and clean the data to ensure that it is accurate, complete, and in a format that is suitable for visualization. We also perform exploratory data analysis to identify patterns and insights that can inform the design of the visualizations.
Visualization Design: We use a variety of tools and techniques to create visually compelling and interactive data visualizations that effectively communicate insights to the audience. We pay attention to the details of the visualization, such as color, layout, and typography, to make sure that the message is clear and understandable.
Iteration and Feedback: We work closely with the client to iterate and refine the visualizations based on their feedback. We use an agile development approach that allows us to quickly make changes and adjustments to the visualization based on the client's needs.
Delivery and Training: Once the visualizations are complete, we deliver them to the client in a format that is easily accessible and shareable. We also provide training and support to help clients understand how to use the visualizations effectively and how to interpret the insights.
Overall, our data visualization service is designed to help clients make sense of their data and communicate it effectively to their stakeholders. Our team of data experts and visualization designers work closely with clients to develop customized solutions that meet their specific needs and objectives.
What's included
Interactive dashboards and reports
These are customized dashboards and reports that allow the client to view and analyze the data in a user-friendly and easily digestible format. These reports can be shared with team members, stakeholders, or clients as needed.
Documentation and user manuals
Depending on the scope of work, we may provide documentation and user manuals that describe how the dashboards, reports, and data models were developed and how they can be used.
Example work
Irfan's other services
$100