
Helping you Unlock Insights with Stunning Data VisualizationsSimon Edet
I offer tailored data visualization services that transform complex data into clear, actionable insights through engaging and interactive visual formats. What sets me apart is my ability to combine advanced design techniques with a deep understanding of data storytelling, ensuring that each visualization not only looks stunning but also drives meaningful decision-making.
What's included
Interactive Dashboards
Customized, interactive dashboards that allow users to explore data dynamically through filters and drill-downs, providing real-time insights and visual analytics.
Visual Reports
Comprehensive reports featuring a collection of charts, graphs, and other visual elements that summarize and communicate key findings and trends.
Charts and Graphs
High-quality, standalone charts and graphs designed to clearly illustrate specific data points and trends, tailored to the client’s needs.
Infographics
Engaging infographics that present complex data in a visually appealing and easily understandable format, combining visuals and concise text.
Presentation Slides
A set of presentation slides featuring visualizations and key insights, designed for stakeholder meetings or client presentations.
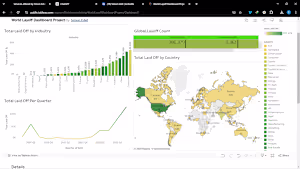
Example work

Simon's other services

Starting at$250
Duration1 week
Tags
Microsoft Power BI


Tableau

Data Analyst
Data Visualizer
Service provided by
Simon Edet Nigeria
Helping you Unlock Insights with Stunning Data VisualizationsSimon Edet
Starting at$250
Duration1 week
Tags
Microsoft Power BI
Tableau
Data Analyst
Data Visualizer
I offer tailored data visualization services that transform complex data into clear, actionable insights through engaging and interactive visual formats. What sets me apart is my ability to combine advanced design techniques with a deep understanding of data storytelling, ensuring that each visualization not only looks stunning but also drives meaningful decision-making.
What's included
Interactive Dashboards
Customized, interactive dashboards that allow users to explore data dynamically through filters and drill-downs, providing real-time insights and visual analytics.
Visual Reports
Comprehensive reports featuring a collection of charts, graphs, and other visual elements that summarize and communicate key findings and trends.
Charts and Graphs
High-quality, standalone charts and graphs designed to clearly illustrate specific data points and trends, tailored to the client’s needs.
Infographics
Engaging infographics that present complex data in a visually appealing and easily understandable format, combining visuals and concise text.
Presentation Slides
A set of presentation slides featuring visualizations and key insights, designed for stakeholder meetings or client presentations.
Example work
Simon's other services
$250