
Data visualization in Tableau and PowerBIIhtisham Mehmood
I offer data visualization services, providing clients with interactive dashboards, visual reports, and data-driven presentations that make complex data easy to understand and actionable. My approach is centered on creating clear, visually compelling insights tailored to each client's needs. What sets me apart is my blend of technical expertise and focus on crafting engaging, intuitive visual solutions that empower businesses to make informed decisions quickly.
What's included
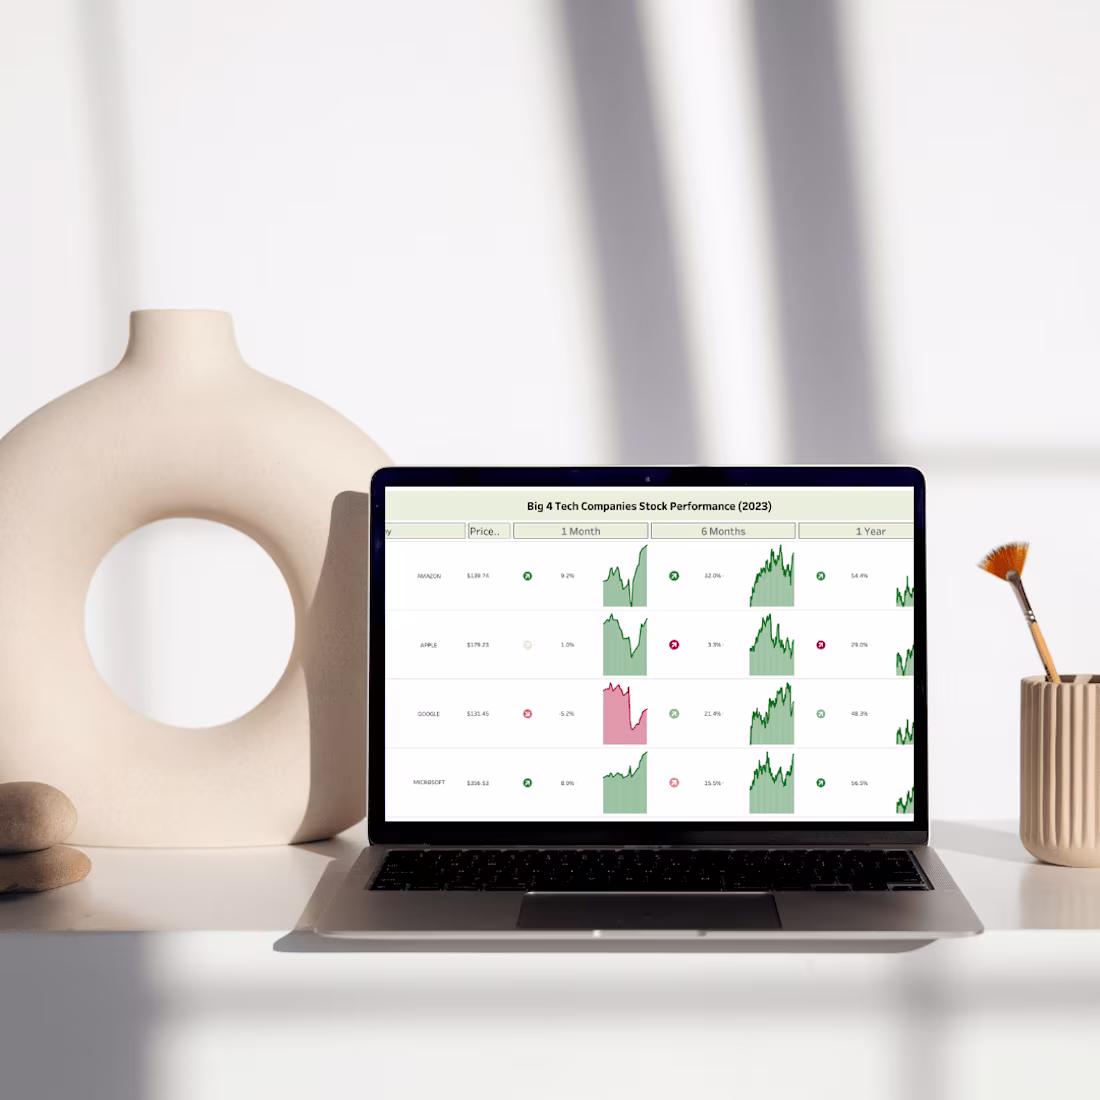
Interactive Dashboards
Custom-built dashboards using tools like Tableau, Power BI that allow clients to explore data and insights in real-time.
Visual Reports
Professionally designed charts, graphs, and plots that clearly present trends, patterns, and insights, often provided in formats like PDFs or presentation slides.
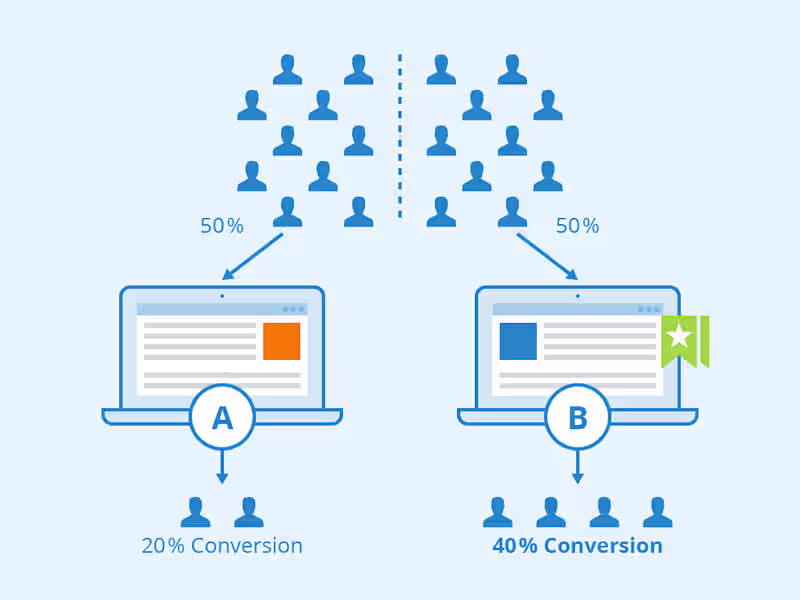
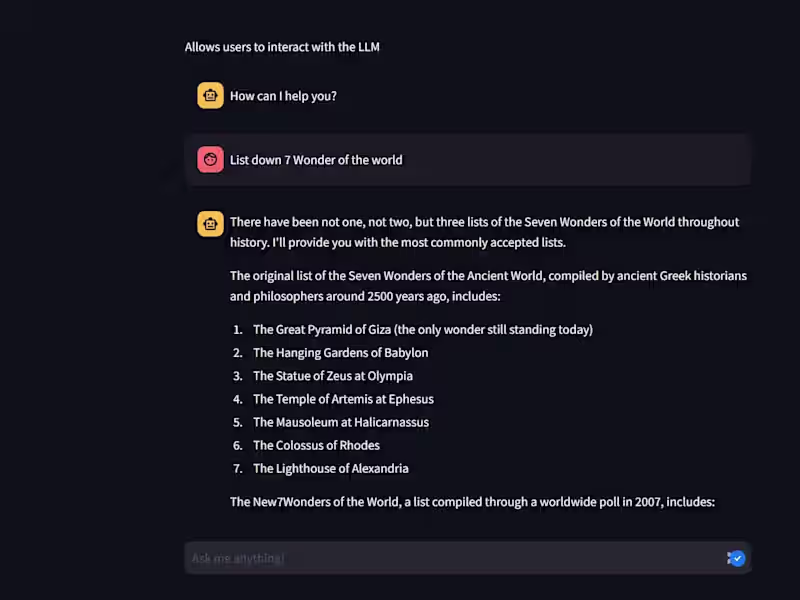
Data Storytelling Presentations
A structured narrative combining visualizations with key insights to communicate findings and actionable conclusions effectively.
Ihtisham's other services
Starting at$39 /hr
Tags
Microsoft Excel
Python
Tableau
Data Analyst
Data Visualizer
Service provided by
Ihtisham Mehmood Multan, Pakistan
- 2
- Followers
Data visualization in Tableau and PowerBIIhtisham Mehmood
Starting at$39 /hr
Tags
Microsoft Excel
Python
Tableau
Data Analyst
Data Visualizer
I offer data visualization services, providing clients with interactive dashboards, visual reports, and data-driven presentations that make complex data easy to understand and actionable. My approach is centered on creating clear, visually compelling insights tailored to each client's needs. What sets me apart is my blend of technical expertise and focus on crafting engaging, intuitive visual solutions that empower businesses to make informed decisions quickly.
What's included
Interactive Dashboards
Custom-built dashboards using tools like Tableau, Power BI that allow clients to explore data and insights in real-time.
Visual Reports
Professionally designed charts, graphs, and plots that clearly present trends, patterns, and insights, often provided in formats like PDFs or presentation slides.
Data Storytelling Presentations
A structured narrative combining visualizations with key insights to communicate findings and actionable conclusions effectively.
Ihtisham's other services
$39 /hr