
Power BI DashboardReshma Ganesh
This project focuses on the development of a customized Power BI dashboard tailored to your organization's specific needs. The objective is to provide a powerful data visualization and analysis tool that empowers your team to make data-driven decisions effectively.
What's included
Power Bi Dashboard
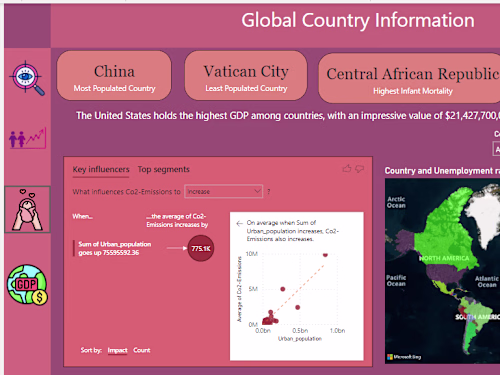
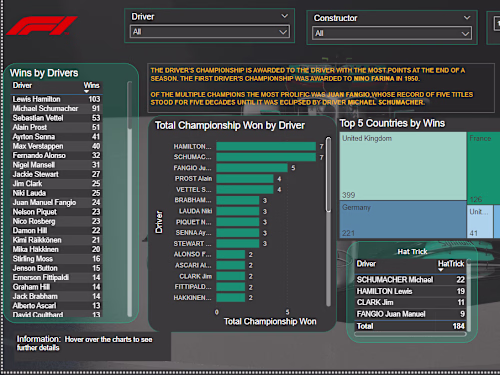
Custom Power BI Dashboard: A fully developed and customized Power BI dashboard that integrates with your data sources and displays relevant insights in a visually compelling manner.
Data Integration: We will connect and integrate the necessary data sources, ensuring that your dashboard reflects real-time or periodic updates as required.
Data Modeling: Designing an efficient data model that supports complex data relationships and calculations to provide meaningful insights.
Visualizations: Creating a variety of visualizations such as charts, graphs, tables, and maps to represent data in a user-friendly and intuitive format.
Interactive Features: Implementing interactive features, such as drill-throughs, filters, and slicers, to enable users to explore data and gain deeper insights.
Reshma's other services


Power BI DashboardReshma Ganesh
Contact for pricing
Tags
Microsoft Power BI
Data Visualizer
This project focuses on the development of a customized Power BI dashboard tailored to your organization's specific needs. The objective is to provide a powerful data visualization and analysis tool that empowers your team to make data-driven decisions effectively.
What's included
Power Bi Dashboard
Custom Power BI Dashboard: A fully developed and customized Power BI dashboard that integrates with your data sources and displays relevant insights in a visually compelling manner.
Data Integration: We will connect and integrate the necessary data sources, ensuring that your dashboard reflects real-time or periodic updates as required.
Data Modeling: Designing an efficient data model that supports complex data relationships and calculations to provide meaningful insights.
Visualizations: Creating a variety of visualizations such as charts, graphs, tables, and maps to represent data in a user-friendly and intuitive format.
Interactive Features: Implementing interactive features, such as drill-throughs, filters, and slicers, to enable users to explore data and gain deeper insights.
Reshma's other services
Contact for pricing