
Improved Data Insights via Visualization and/or QueriesLynea Bernhard
What makes me unique is that I have 15 years of experience in SQL and Business Intelligence, and have been nicknamed, “The Closer” by some managers due to my ability to get their most challenging projects ‘closed’. Not only that, I always use all my skills to proactively achieve even better results that hoped. I love what I do: I am a visualization expert, an insightful data analyst, and a highly skilled writer of optimized stored procedures.
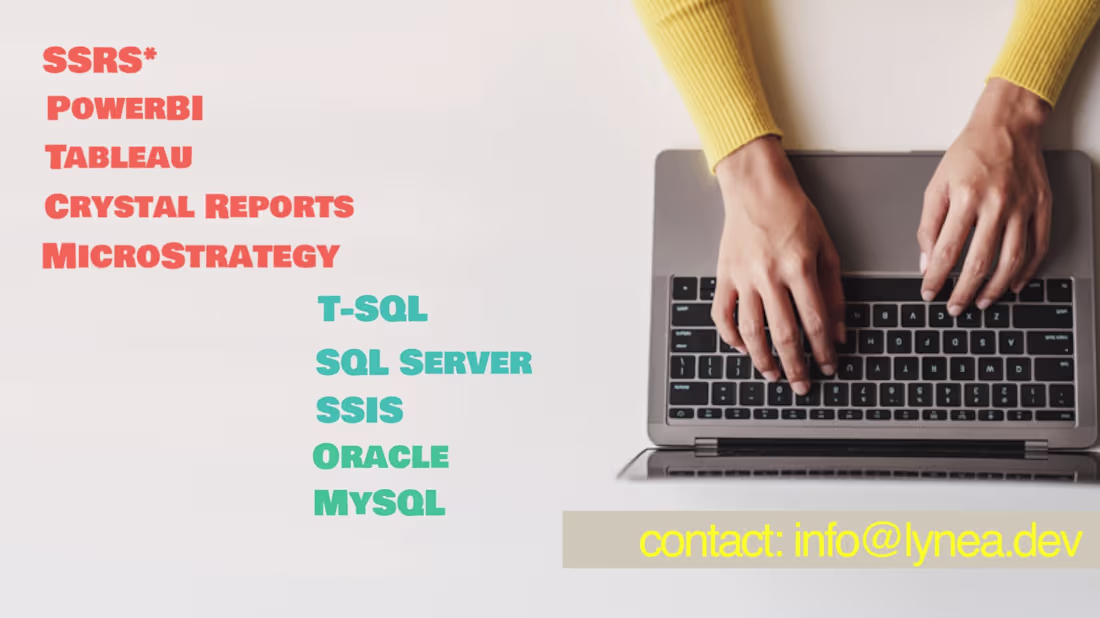
What's included
Data Analysis
Data analysis that tells a story providing better insights, answers existing questions and indicates new questions. This is data analysis that uncovers, also, data anomalies and helps to explain them. If you have data anomalies that need to be discovered and remedied, I can help get this done in the quickest time, and, if you like, even impart the method I created to discover it. I will uncover data issues and get them resolved.
Data Visualization
Data needs to tell a story: answer existing business questions but also indicated what new business questions need to be asked. What is the focus? What should be the focus? What is the best course of action(s)? All these can be included in your visualization story.
Query Optimization
Every developer has ideas about optimization, but I can deliver these significant improvements 99% of the time. Whether the stored procedure is for ETL or in support of a report, I can help these procedures run at their optimized best, especially if they are in SQL Server.
Lynea's other services

Contact for pricing
Tags
Google BigQuery
SQL
Tableau
Data Scientist
Data Visualizer
Service provided by
Lynea Bernhard United States
Improved Data Insights via Visualization and/or QueriesLynea Bernhard
Contact for pricing
Tags
Google BigQuery
SQL
Tableau
Data Scientist
Data Visualizer
What makes me unique is that I have 15 years of experience in SQL and Business Intelligence, and have been nicknamed, “The Closer” by some managers due to my ability to get their most challenging projects ‘closed’. Not only that, I always use all my skills to proactively achieve even better results that hoped. I love what I do: I am a visualization expert, an insightful data analyst, and a highly skilled writer of optimized stored procedures.
What's included
Data Analysis
Data analysis that tells a story providing better insights, answers existing questions and indicates new questions. This is data analysis that uncovers, also, data anomalies and helps to explain them. If you have data anomalies that need to be discovered and remedied, I can help get this done in the quickest time, and, if you like, even impart the method I created to discover it. I will uncover data issues and get them resolved.
Data Visualization
Data needs to tell a story: answer existing business questions but also indicated what new business questions need to be asked. What is the focus? What should be the focus? What is the best course of action(s)? All these can be included in your visualization story.
Query Optimization
Every developer has ideas about optimization, but I can deliver these significant improvements 99% of the time. Whether the stored procedure is for ETL or in support of a report, I can help these procedures run at their optimized best, especially if they are in SQL Server.
Lynea's other services
Contact for pricing