
Business Intelligence Dashboard in Power BI and TableauShana Nasrin
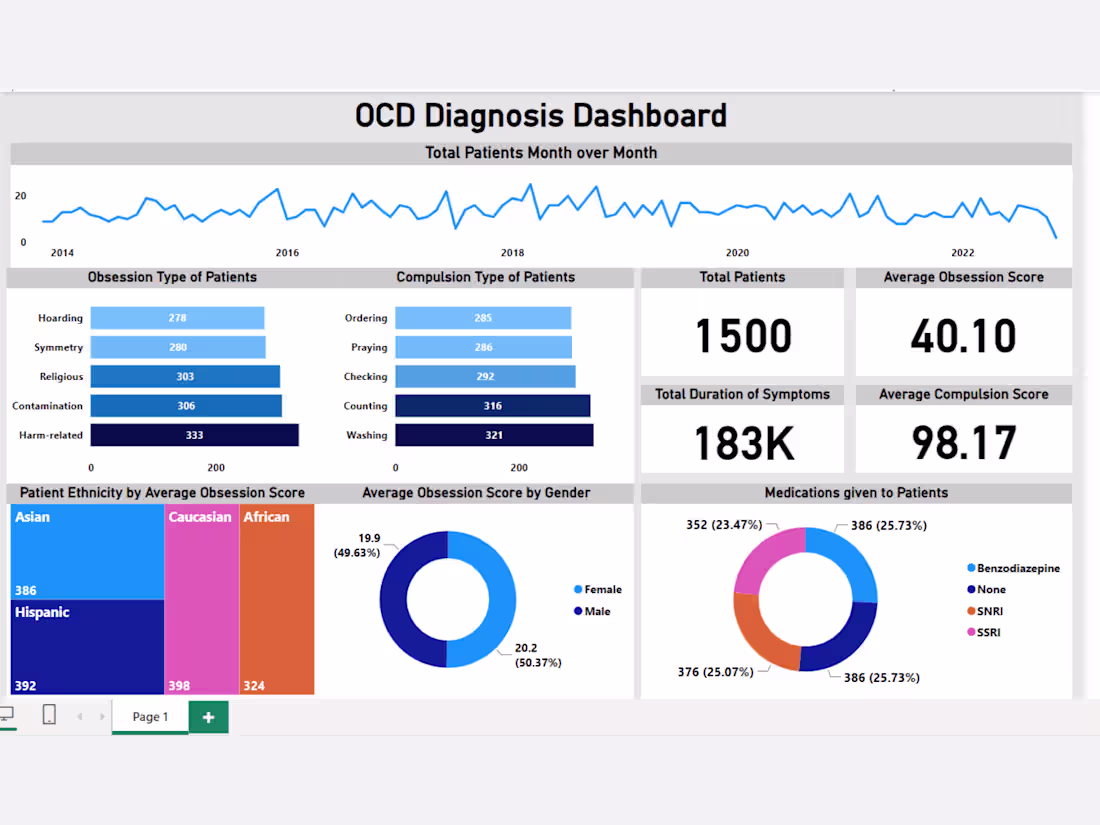
I create dynamic and visually appealing business intelligence dashboards in Tableau and Power BI, tailored to meet your unique business goals. My dashboards go beyond simple visualizations by integrating clear storytelling and actionable insights, helping you make data-driven decisions with ease. With a focus on user-friendly designs and attention to detail, I deliver tools that empower your team to track performance and uncover growth opportunities.
What's included
Dashboard
This include interactive dashboard in Tableau or Power BI.
Cleaned Dataset
After cleaning and transformation, the final dataset is provided in a format (such as CSV, Excel, or SQL database) that can be used or analyzed further.
PowerPoint Presentation
A PowerPoint Presentation including Analysis performed, Key Findings, Actionable Insights and Recommendations.
FAQs
Starting at$25 /hr
Tags
Microsoft Power BI
Tableau
Business Analyst
Data Analyst
Data Visualizer
Service provided by
Shana Nasrin Puthukkad, India
Business Intelligence Dashboard in Power BI and TableauShana Nasrin
Starting at$25 /hr
Tags
Microsoft Power BI
Tableau
Business Analyst
Data Analyst
Data Visualizer
I create dynamic and visually appealing business intelligence dashboards in Tableau and Power BI, tailored to meet your unique business goals. My dashboards go beyond simple visualizations by integrating clear storytelling and actionable insights, helping you make data-driven decisions with ease. With a focus on user-friendly designs and attention to detail, I deliver tools that empower your team to track performance and uncover growth opportunities.
What's included
Dashboard
This include interactive dashboard in Tableau or Power BI.
Cleaned Dataset
After cleaning and transformation, the final dataset is provided in a format (such as CSV, Excel, or SQL database) that can be used or analyzed further.
PowerPoint Presentation
A PowerPoint Presentation including Analysis performed, Key Findings, Actionable Insights and Recommendations.
FAQs
$25 /hr