
Professional Data Visualization & Dashboard Design 📊✨mouzouna samir
I provide professional data analysis services, transforming raw data into actionable insights through cleaning, visualization, and predictive modeling. Using tools like Python, SQL, Power BI, and Tableau, I create interactive dashboards and reports that simplify complex data for better decision-making. My unique approach combines technical expertise with clear storytelling, ensuring data-driven strategies that drive business success. 🚀📊
What's included
Data Cleaning Report
A detailed report outlining the data cleaning process, including handling missing values, duplicates, outliers, and formatting inconsistencies.
Exploratory Data Analysis (EDA) Report
A summary of key patterns, trends, and initial insights found in the dataset, presented with statistical summaries and visualizations.
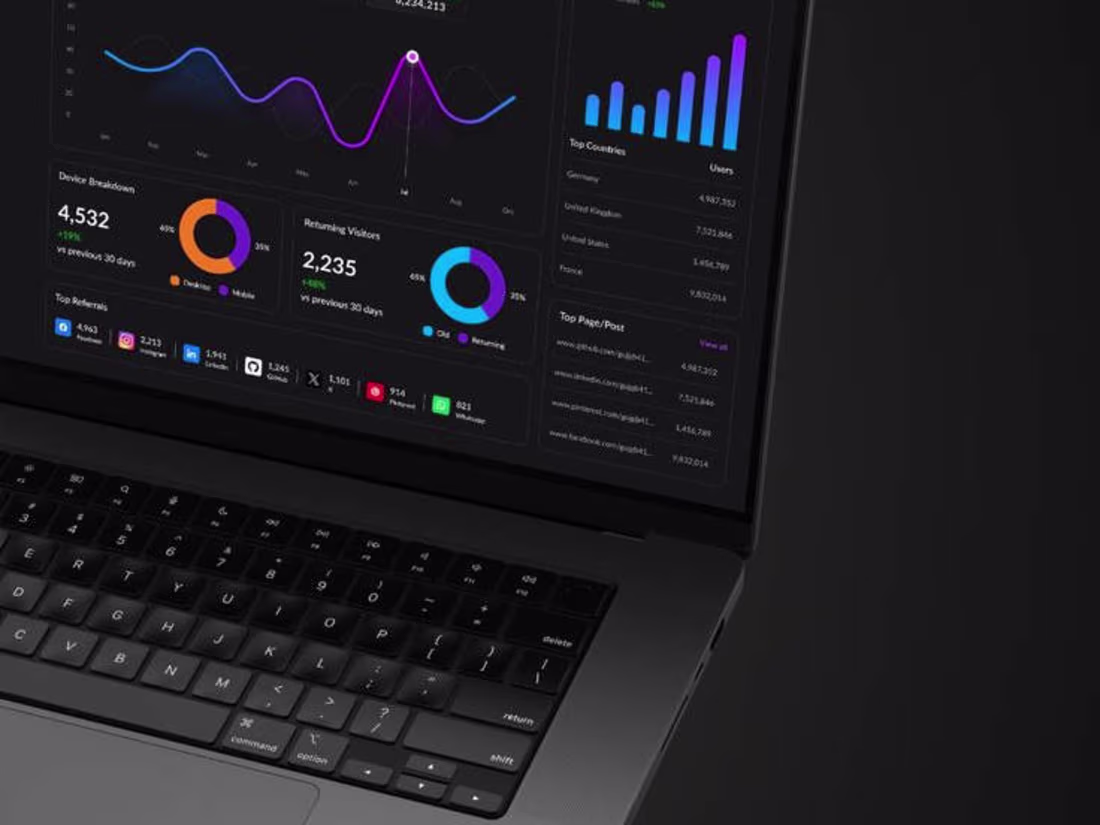
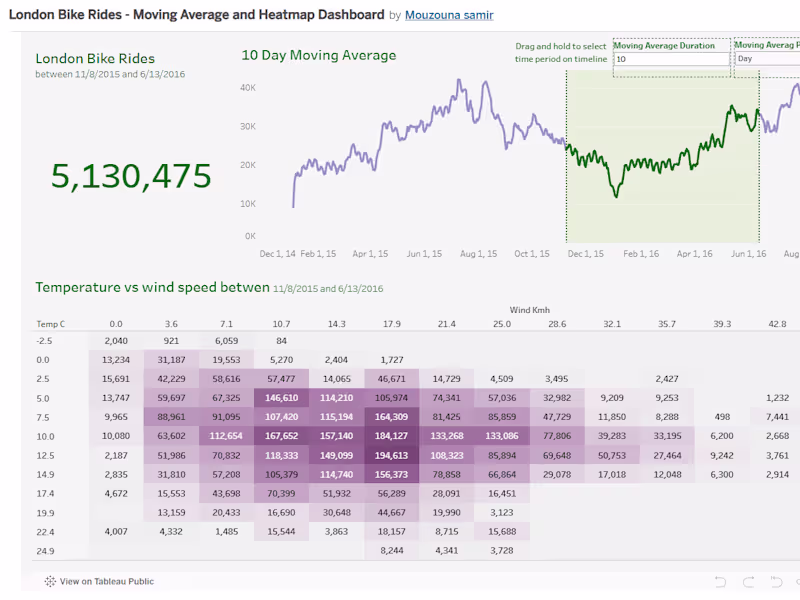
Data Visualization Dashboard
An interactive or static dashboard using tools like Power BI, Tableau, or Python to present insights with charts and graphs.
Processed & Cleaned Dataset
A structured and refined dataset in CSV, Excel, or SQL format, ready for further use or business applications.
mouzouna's other services
Starting at$350
Duration2 weeks
Tags
Matplotlib
Microsoft Excel
pandas
Tableau
Data Analyst
Data Scientist
Data Visualizer
Service provided by
mouzouna samir Casablanca, Morocco
Professional Data Visualization & Dashboard Design 📊✨mouzouna samir
Starting at$350
Duration2 weeks
Tags
Matplotlib
Microsoft Excel
pandas
Tableau
Data Analyst
Data Scientist
Data Visualizer
I provide professional data analysis services, transforming raw data into actionable insights through cleaning, visualization, and predictive modeling. Using tools like Python, SQL, Power BI, and Tableau, I create interactive dashboards and reports that simplify complex data for better decision-making. My unique approach combines technical expertise with clear storytelling, ensuring data-driven strategies that drive business success. 🚀📊
What's included
Data Cleaning Report
A detailed report outlining the data cleaning process, including handling missing values, duplicates, outliers, and formatting inconsistencies.
Exploratory Data Analysis (EDA) Report
A summary of key patterns, trends, and initial insights found in the dataset, presented with statistical summaries and visualizations.
Data Visualization Dashboard
An interactive or static dashboard using tools like Power BI, Tableau, or Python to present insights with charts and graphs.
Processed & Cleaned Dataset
A structured and refined dataset in CSV, Excel, or SQL format, ready for further use or business applications.
mouzouna's other services
$350