
Transform Your Business with Data-Driven Insightssaikat nandi
I offer comprehensive Power BI solutions, including data modeling, interactive reports, and insightful dashboards tailored to your specific needs. What sets me apart is my ability to integrate multiple data sources seamlessly, provide robust documentation, and offer ongoing training and support to ensure you get the most value out of your data. Plus, my optimization techniques ensure your reports perform efficiently, even with large datasets.
What's included
In a Power BI project, the deliverables can vary depending on the specific requirements and scope of the project. However, here are some common deliverables that a client can expect
Data Models: These are structured representations of the client's data sources, optimized for reporting and analysis purposes.
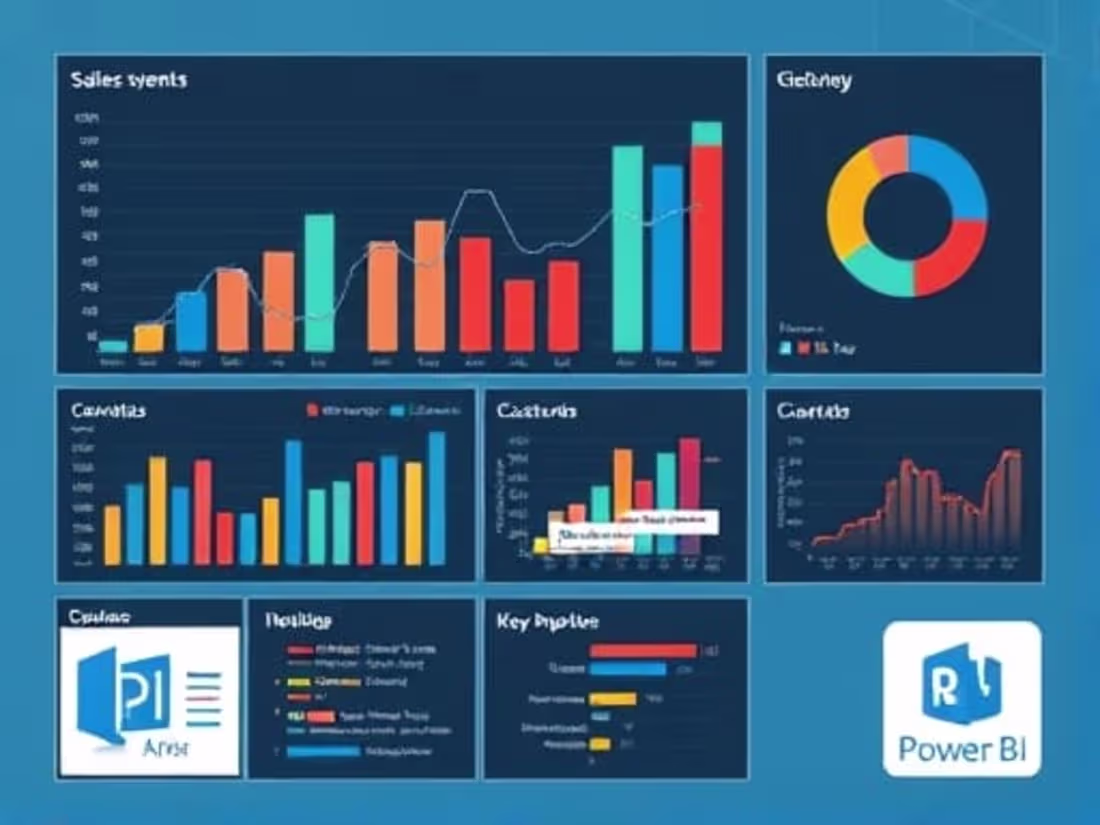
Reports and Dashboards: Visually appealing and interactive reports and dashboards that provide insights and key performance indicators (KPIs) tailored to the client's needs.
Data Visualizations: Custom visualizations that help in understanding complex data through charts, graphs, and maps.
Data Integration: Ensuring seamless integration of various data sources, including databases, spreadsheets, cloud services, and other external data systems.
Data Transformation Scripts: Scripts for cleaning, transforming, and preparing data for analysis, often using Power Query or other data manipulation tools.
Documentation: Comprehensive documentation that details the data models, reports, visualizations, and any other components created during the project.
Training and Support: Training sessions and support materials to help the client understand and effectively use Power BI to gain insights from their data.
Deployment and Configuration: Assistance with deploying the Power BI reports and dashboards to the Power BI Service, setting up data refresh schedules, and configuring security settings.
Performance Optimization: Techniques and strategies implemented to ensure the Power BI reports and dashboards perform efficiently, especially with large datasets.
Project Summary: A final project summary or presentation that outlines the work done, key findings, and recommendations for future actions.
saikat's other services

Contact for pricing
Tags
Microsoft Power BI
Data Analyst
Data Visualizer
Product Data Analyst
Service provided by
saikat nandi Pune, India
Transform Your Business with Data-Driven Insightssaikat nandi
Contact for pricing
Tags
Microsoft Power BI
Data Analyst
Data Visualizer
Product Data Analyst
I offer comprehensive Power BI solutions, including data modeling, interactive reports, and insightful dashboards tailored to your specific needs. What sets me apart is my ability to integrate multiple data sources seamlessly, provide robust documentation, and offer ongoing training and support to ensure you get the most value out of your data. Plus, my optimization techniques ensure your reports perform efficiently, even with large datasets.
What's included
In a Power BI project, the deliverables can vary depending on the specific requirements and scope of the project. However, here are some common deliverables that a client can expect
Data Models: These are structured representations of the client's data sources, optimized for reporting and analysis purposes.
Reports and Dashboards: Visually appealing and interactive reports and dashboards that provide insights and key performance indicators (KPIs) tailored to the client's needs.
Data Visualizations: Custom visualizations that help in understanding complex data through charts, graphs, and maps.
Data Integration: Ensuring seamless integration of various data sources, including databases, spreadsheets, cloud services, and other external data systems.
Data Transformation Scripts: Scripts for cleaning, transforming, and preparing data for analysis, often using Power Query or other data manipulation tools.
Documentation: Comprehensive documentation that details the data models, reports, visualizations, and any other components created during the project.
Training and Support: Training sessions and support materials to help the client understand and effectively use Power BI to gain insights from their data.
Deployment and Configuration: Assistance with deploying the Power BI reports and dashboards to the Power BI Service, setting up data refresh schedules, and configuring security settings.
Performance Optimization: Techniques and strategies implemented to ensure the Power BI reports and dashboards perform efficiently, especially with large datasets.
Project Summary: A final project summary or presentation that outlines the work done, key findings, and recommendations for future actions.
saikat's other services
Contact for pricing