
Dashboard using Power BI, TableauAjit Kumar Gupta
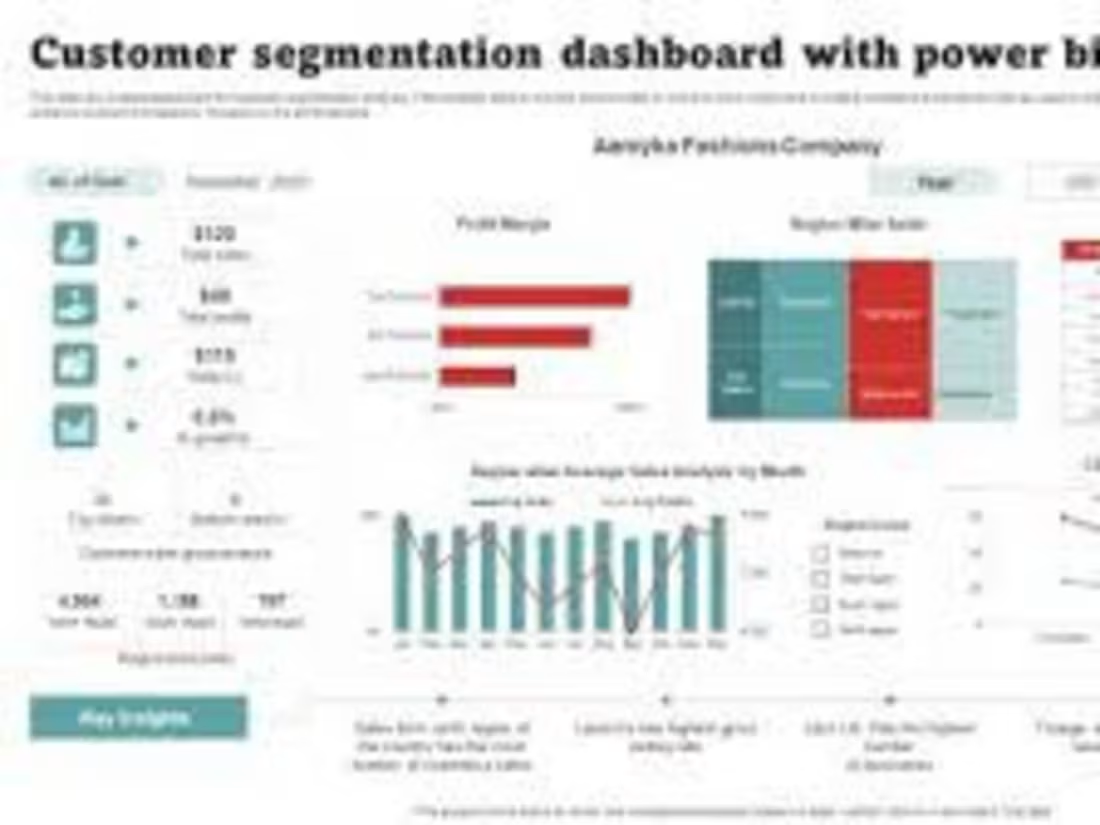
This Power BI dashboard offers a clear, interactive way to monitor and analyze key business metrics. It features dynamic charts and tables that update in real time, allowing you to filter data and gain detailed insights for better decision-making. Its user-friendly design ensures you can quickly understand performance trends and make informed choices.
What's included
visualizations and real-time data analysis
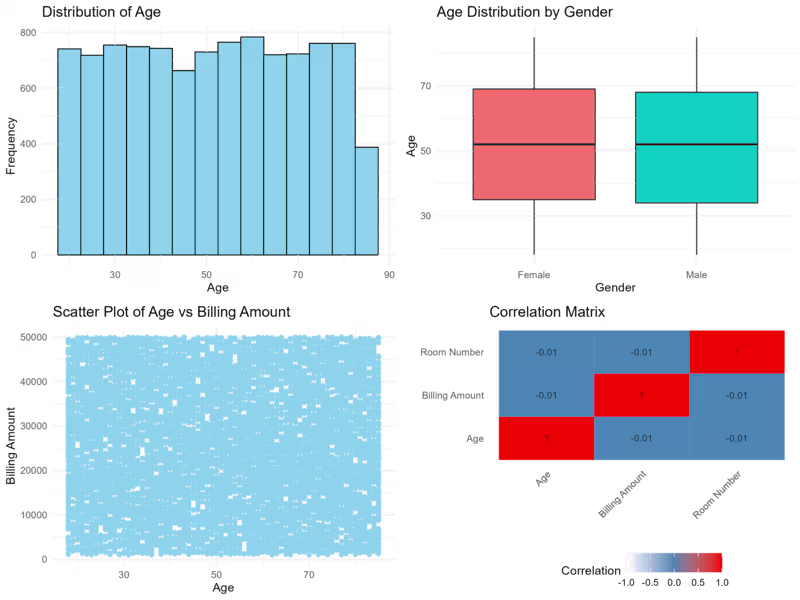
features dynamic charts, graphs, and tables to track performance across various dimensions, such as sales, customer demographics, and financial metrics. Users can filter data by different criteria, drill down into detailed insights, and customize views to fit specific needs. The dashboard’s intuitive design and real-time updates enable quick decision-making and strategic planning, helping you stay on top of trends and make informed business choices.
Ajit's other services
Contact for pricing
Tags
D3.js
Matplotlib
Tableau
TensorFlow
three.js
Data Analyst
Data Scientist
Data Visualizer
Service provided by
Ajit Kumar Gupta Varanasi, India
Dashboard using Power BI, TableauAjit Kumar Gupta
Contact for pricing
Tags
D3.js
Matplotlib
Tableau
TensorFlow
three.js
Data Analyst
Data Scientist
Data Visualizer
This Power BI dashboard offers a clear, interactive way to monitor and analyze key business metrics. It features dynamic charts and tables that update in real time, allowing you to filter data and gain detailed insights for better decision-making. Its user-friendly design ensures you can quickly understand performance trends and make informed choices.
What's included
visualizations and real-time data analysis
features dynamic charts, graphs, and tables to track performance across various dimensions, such as sales, customer demographics, and financial metrics. Users can filter data by different criteria, drill down into detailed insights, and customize views to fit specific needs. The dashboard’s intuitive design and real-time updates enable quick decision-making and strategic planning, helping you stay on top of trends and make informed business choices.
Ajit's other services
Contact for pricing