
Data Analysis Waqas Ali
Data analysis in Excel involves using Excel's built-in tools and functions to manipulate and analyze data. Here are the steps involved in data analysis using Excel:
Import or input data: The first step in data analysis is to import or input the data into Excel. You can either import data from an external source such as a CSV file, or input it manually into an Excel worksheet.
Clean and prepare the data: Once the data is imported or input, you will need to clean and prepare it for analysis. This may involve removing duplicates, filling in missing values, or converting data types.
Organize and format the data: Organize the data in a logical manner and format it for easy reading. Use headings, subheadings, and different fonts and colors to distinguish between different data points.
Use Excel functions and formulas: Excel offers a wide range of functions and formulas that can be used to manipulate and analyze data. Some common functions used in data analysis include SUM, AVERAGE, COUNT, MAX, and MIN.
Use PivotTables: PivotTables are a powerful tool in Excel that can be used to summarize and analyze large amounts of data quickly and easily. PivotTables allow you to group and filter data, calculate totals and subtotals, and create charts and graphs.
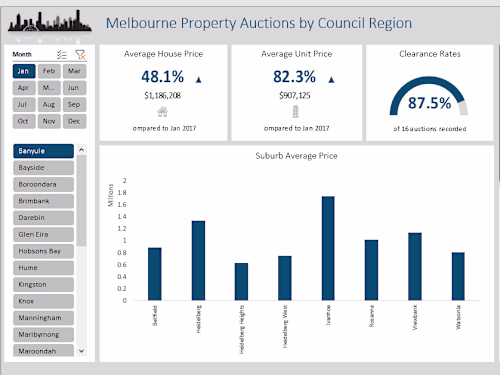
Use Excel charts and graphs: Excel offers a variety of chart and graph types that can be used to visualize data. Charts and graphs can make it easier to understand trends and patterns in the data.
Analyze the data: Once the data has been organized, cleaned, and formatted, and Excel functions, formulas, PivotTables, and charts have been applied, you can begin to analyze the data. Look for trends, patterns, and outliers in the data, and draw conclusions based on the results of your analysis.
Draw conclusions and make recommendations: Based on your analysis, draw conclusions and make recommendations. Use the insights gained from the analysis to inform decision-making and improve business processes.
What's included
Refined and clean data
I will clean and refine raw data using excel and make it readable.
Data visualization
ill make your data presentable and attractive.
Example work
Waqas's other services

Data Analysis Waqas Ali
Contact for pricing
Tags
Microsoft Excel
Data Analyst
Data analysis in Excel involves using Excel's built-in tools and functions to manipulate and analyze data. Here are the steps involved in data analysis using Excel:
Import or input data: The first step in data analysis is to import or input the data into Excel. You can either import data from an external source such as a CSV file, or input it manually into an Excel worksheet.
Clean and prepare the data: Once the data is imported or input, you will need to clean and prepare it for analysis. This may involve removing duplicates, filling in missing values, or converting data types.
Organize and format the data: Organize the data in a logical manner and format it for easy reading. Use headings, subheadings, and different fonts and colors to distinguish between different data points.
Use Excel functions and formulas: Excel offers a wide range of functions and formulas that can be used to manipulate and analyze data. Some common functions used in data analysis include SUM, AVERAGE, COUNT, MAX, and MIN.
Use PivotTables: PivotTables are a powerful tool in Excel that can be used to summarize and analyze large amounts of data quickly and easily. PivotTables allow you to group and filter data, calculate totals and subtotals, and create charts and graphs.
Use Excel charts and graphs: Excel offers a variety of chart and graph types that can be used to visualize data. Charts and graphs can make it easier to understand trends and patterns in the data.
Analyze the data: Once the data has been organized, cleaned, and formatted, and Excel functions, formulas, PivotTables, and charts have been applied, you can begin to analyze the data. Look for trends, patterns, and outliers in the data, and draw conclusions based on the results of your analysis.
Draw conclusions and make recommendations: Based on your analysis, draw conclusions and make recommendations. Use the insights gained from the analysis to inform decision-making and improve business processes.
What's included
Refined and clean data
I will clean and refine raw data using excel and make it readable.
Data visualization
ill make your data presentable and attractive.
Example work
Waqas's other services
Contact for pricing