
Business Data Analysis for Efficiency & Cost SavingsJeet Tiwari
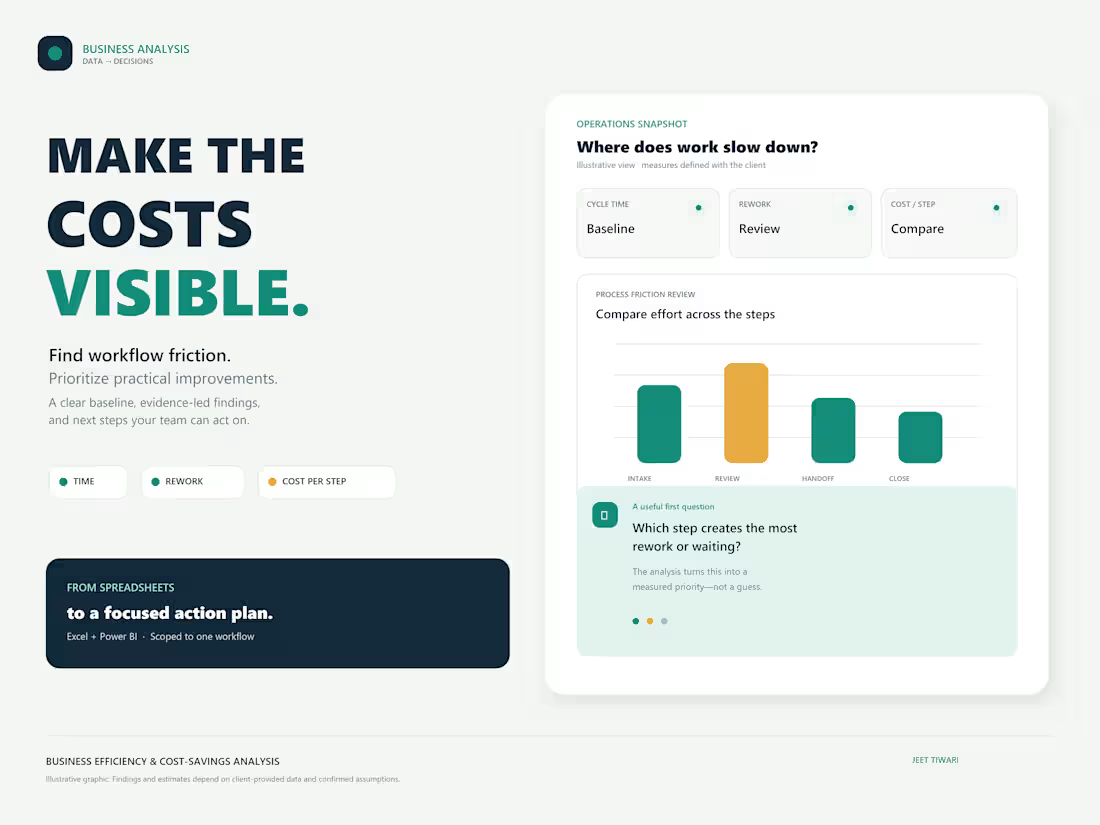
Turn business data into clear, practical next steps
If your team has spreadsheets but still cannot see where work slows down or costs build up, I will analyze one agreed workflow and its available data. The goal is to make the evidence easier to understand and help you decide what to investigate first.
What you will receive
A cleaned, documented dataset for the agreed scope
A baseline view of up to five measures, such as cycle time, rework, volume, or cost per step
A concise findings report with evidence, assumptions, and limitations
A prioritized opportunity matrix ranked by potential value, effort, and confidence
A practical next-step plan and, where useful, a simple Excel or Power BI summary
How we will work
Agree on one business decision, workflow, and client-provided dataset.
Check data quality and confirm the measures and assumptions.
Analyze the baseline and review the findings with you.
Deliver the report, opportunity matrix, and handoff notes.
Starter scope
One workflow, one dataset, up to five agreed measures, one findings report, and one review round. Delivery is within five business days after receiving usable data and confirming the scope.
What I need from you
Please provide the relevant spreadsheet or export, a short explanation of the workflow, definitions for key fields, and any known constraints. Remove or anonymize sensitive data where practical.
Tools
Microsoft Excel and Microsoft Power BI, selected to fit the data and agreed deliverables.
How to interpret potential savings
Any savings or efficiency improvements are estimates based on client-provided data and stated assumptions. Realized results depend on implementation and follow-up measurement.
Contact for pricing
Duration1 week
Tags
Microsoft Excel

Business Analyst
Data Analyst
Power BI
Process Improvement
Service provided by
Jeet Tiwari Ahmedabad, India
- 3
- Followers
Business Data Analysis for Efficiency & Cost SavingsJeet Tiwari
Contact for pricing
Duration1 week
Tags
Microsoft Excel
Business Analyst
Data Analyst
Power BI
Process Improvement
Turn business data into clear, practical next steps
If your team has spreadsheets but still cannot see where work slows down or costs build up, I will analyze one agreed workflow and its available data. The goal is to make the evidence easier to understand and help you decide what to investigate first.
What you will receive
A cleaned, documented dataset for the agreed scope
A baseline view of up to five measures, such as cycle time, rework, volume, or cost per step
A concise findings report with evidence, assumptions, and limitations
A prioritized opportunity matrix ranked by potential value, effort, and confidence
A practical next-step plan and, where useful, a simple Excel or Power BI summary
How we will work
Agree on one business decision, workflow, and client-provided dataset.
Check data quality and confirm the measures and assumptions.
Analyze the baseline and review the findings with you.
Deliver the report, opportunity matrix, and handoff notes.
Starter scope
One workflow, one dataset, up to five agreed measures, one findings report, and one review round. Delivery is within five business days after receiving usable data and confirming the scope.
What I need from you
Please provide the relevant spreadsheet or export, a short explanation of the workflow, definitions for key fields, and any known constraints. Remove or anonymize sensitive data where practical.
Tools
Microsoft Excel and Microsoft Power BI, selected to fit the data and agreed deliverables.
How to interpret potential savings
Any savings or efficiency improvements are estimates based on client-provided data and stated assumptions. Realized results depend on implementation and follow-up measurement.
Contact for pricing