
Interactive Data Visualizations for Insightful Storytellingfredrick otieno
My Data Visualization services transform complex data into clear, visually engaging formats that make insights easily understandable and actionable. I specialize in creating interactive dashboards, custom visual reports, and dynamic infographics that help businesses quickly interpret data and make informed decisions. Each visualization is designed to tell a compelling story, tailored to meet the unique needs of your organization.
What's included
Custom Data Visualization Report
I create customized visualizations that transform complex data into clear, engaging visuals, enabling you to quickly grasp insights and make informed decisions. From interactive dashboards to dynamic infographics, my visual solutions bring your data to life.
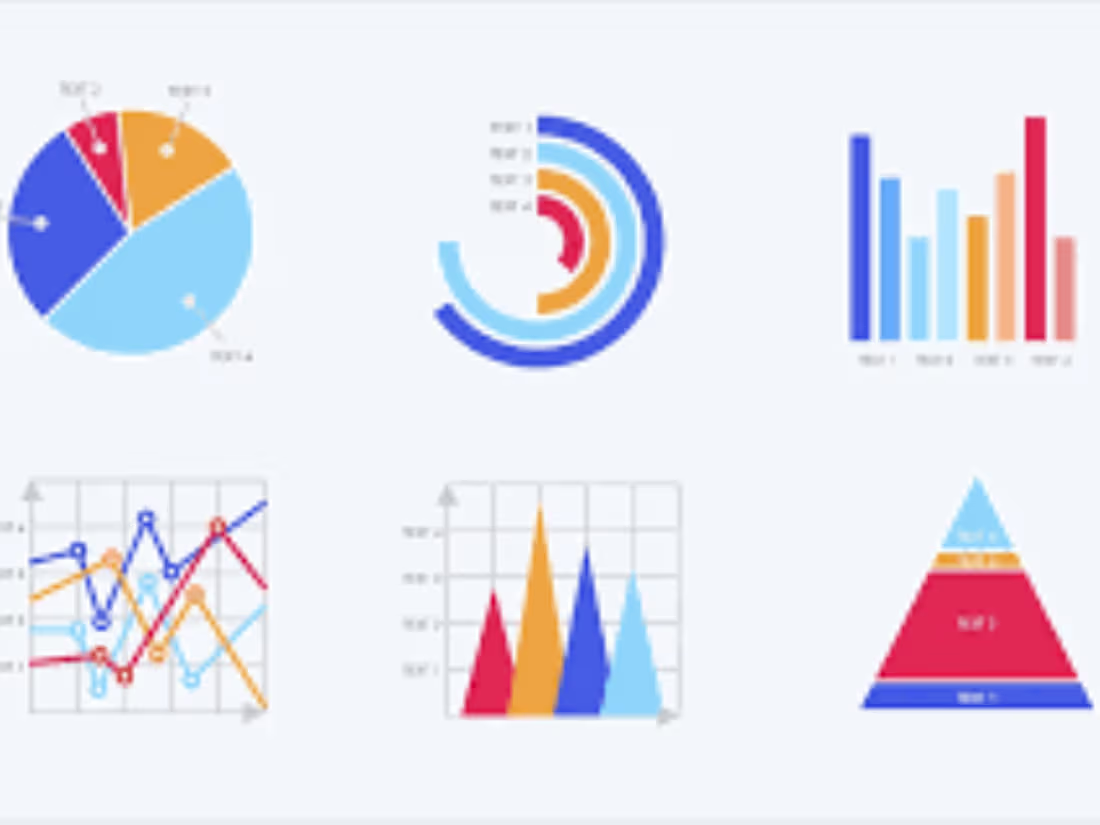
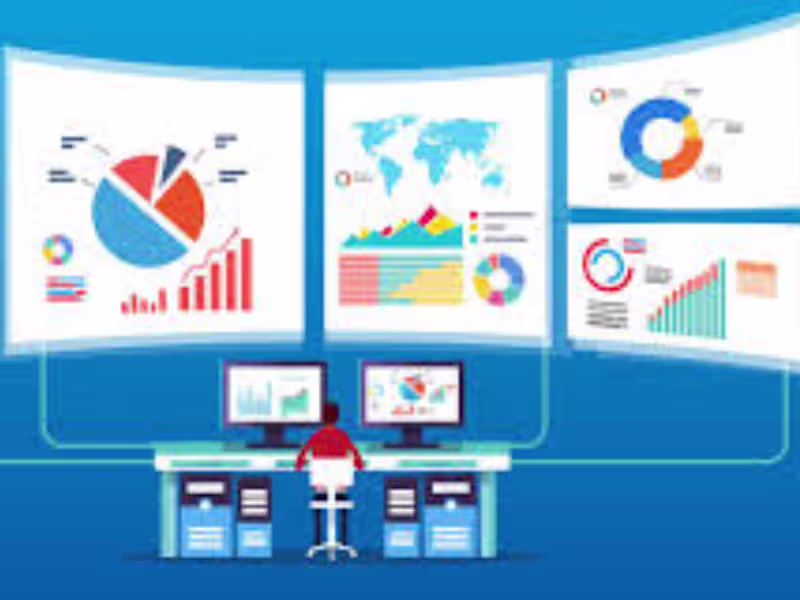
Interactive Dashboards
A comprehensive report featuring a series of charts, graphs, and visual elements that effectively communicate key data insights.
Interactive Dashboards
A comprehensive report featuring a series of charts, graphs, and visual elements that effectively communicate key data insights.
Presentation Decks
Professionally designed slides that visually present data findings and insights, perfect for executive meetings or stakeholder presentations.
fredrick's other services
Contact for pricing
Tags
D3.js
Matplotlib
Microsoft Power BI
Tableau
TensorFlow
Data Analyst
Data Scientist
Data Visualizer
Service provided by
fredrick otieno Nairobi, Kenya
Interactive Data Visualizations for Insightful Storytellingfredrick otieno
Contact for pricing
Tags
D3.js
Matplotlib
Microsoft Power BI
Tableau
TensorFlow
Data Analyst
Data Scientist
Data Visualizer
My Data Visualization services transform complex data into clear, visually engaging formats that make insights easily understandable and actionable. I specialize in creating interactive dashboards, custom visual reports, and dynamic infographics that help businesses quickly interpret data and make informed decisions. Each visualization is designed to tell a compelling story, tailored to meet the unique needs of your organization.
What's included
Custom Data Visualization Report
I create customized visualizations that transform complex data into clear, engaging visuals, enabling you to quickly grasp insights and make informed decisions. From interactive dashboards to dynamic infographics, my visual solutions bring your data to life.
Interactive Dashboards
A comprehensive report featuring a series of charts, graphs, and visual elements that effectively communicate key data insights.
Interactive Dashboards
A comprehensive report featuring a series of charts, graphs, and visual elements that effectively communicate key data insights.
Presentation Decks
Professionally designed slides that visually present data findings and insights, perfect for executive meetings or stakeholder presentations.
fredrick's other services
Contact for pricing