
Data visualization in R studioShehryar Ahmad Khalil
I specialize in transforming client-provided data into visually compelling representations that convey clear and concise insights. With a proven track record in this domain, I have successfully executed projects that have garnered positive reviews. My expertise lies in crafting visualizations that not only enhance data comprehension but also ensure the crystalline clarity of the presented information. I am committed to delivering results that exceed expectations and contribute to a deeper understanding of the underlying data.
What's included
bar charts, pie charts, histogram and heatmap .
Crystal clear results according to the data given by the client the result will be shown on bar graphs ,pie charts , histograms, heatmaps.
Shehryar Ahmad's other services

Starting at$70
Duration1 week
Tags
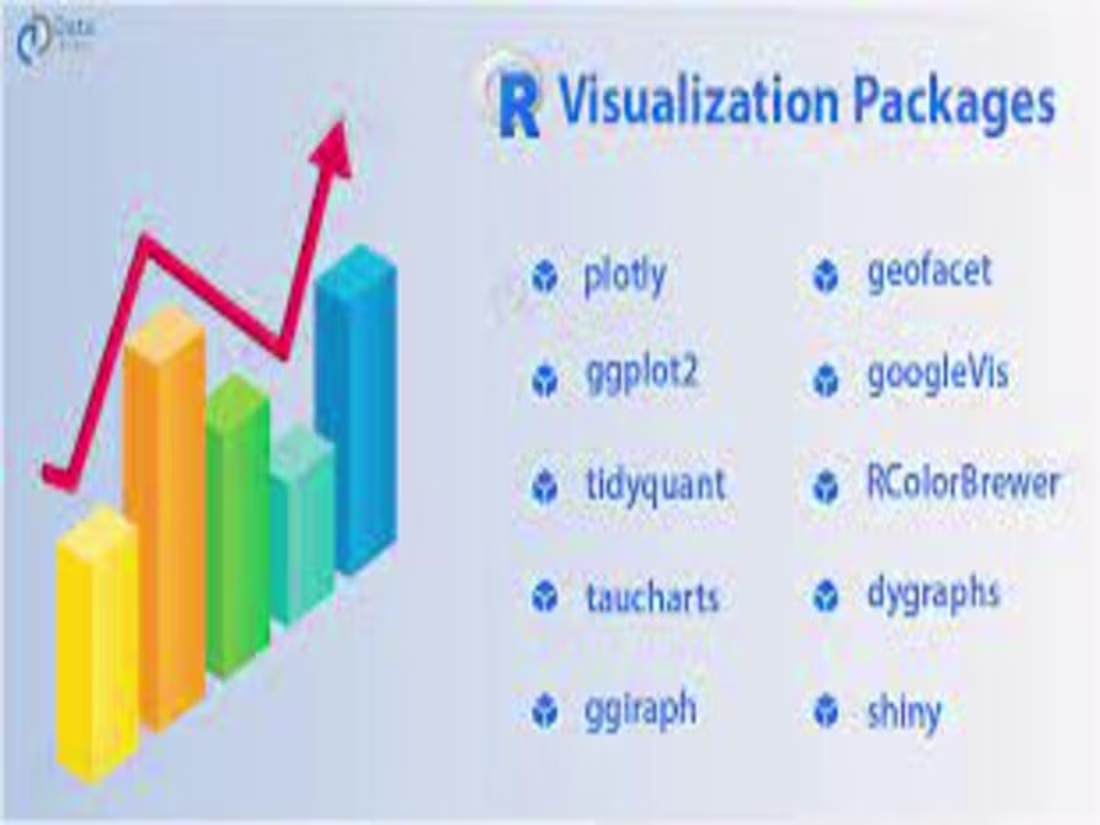
ggplot2
IntelliJ
RStudio
Data Analyst
Data Visualizer
Virtualization Engineer
Service provided by
Shehryar Ahmad Khalil Islamabad, Pakistan
Data visualization in R studioShehryar Ahmad Khalil
Starting at$70
Duration1 week
Tags
ggplot2
IntelliJ
RStudio
Data Analyst
Data Visualizer
Virtualization Engineer
I specialize in transforming client-provided data into visually compelling representations that convey clear and concise insights. With a proven track record in this domain, I have successfully executed projects that have garnered positive reviews. My expertise lies in crafting visualizations that not only enhance data comprehension but also ensure the crystalline clarity of the presented information. I am committed to delivering results that exceed expectations and contribute to a deeper understanding of the underlying data.
What's included
bar charts, pie charts, histogram and heatmap .
Crystal clear results according to the data given by the client the result will be shown on bar graphs ,pie charts , histograms, heatmaps.
Shehryar Ahmad's other services
$70