
Make Data Make Sense!Abhishek Gulbhile
I offer comprehensive Data Visualization and Analysis services tailored to your specific needs. With expertise in creating interactive dashboards, visual presentations, and insightful reports, I help transform complex data into actionable insights. What sets me apart is my ability to not only visualize data effectively but also provide clear interpretations and actionable recommendations, empowering you to make informed decisions and drive success in your business.
What's included
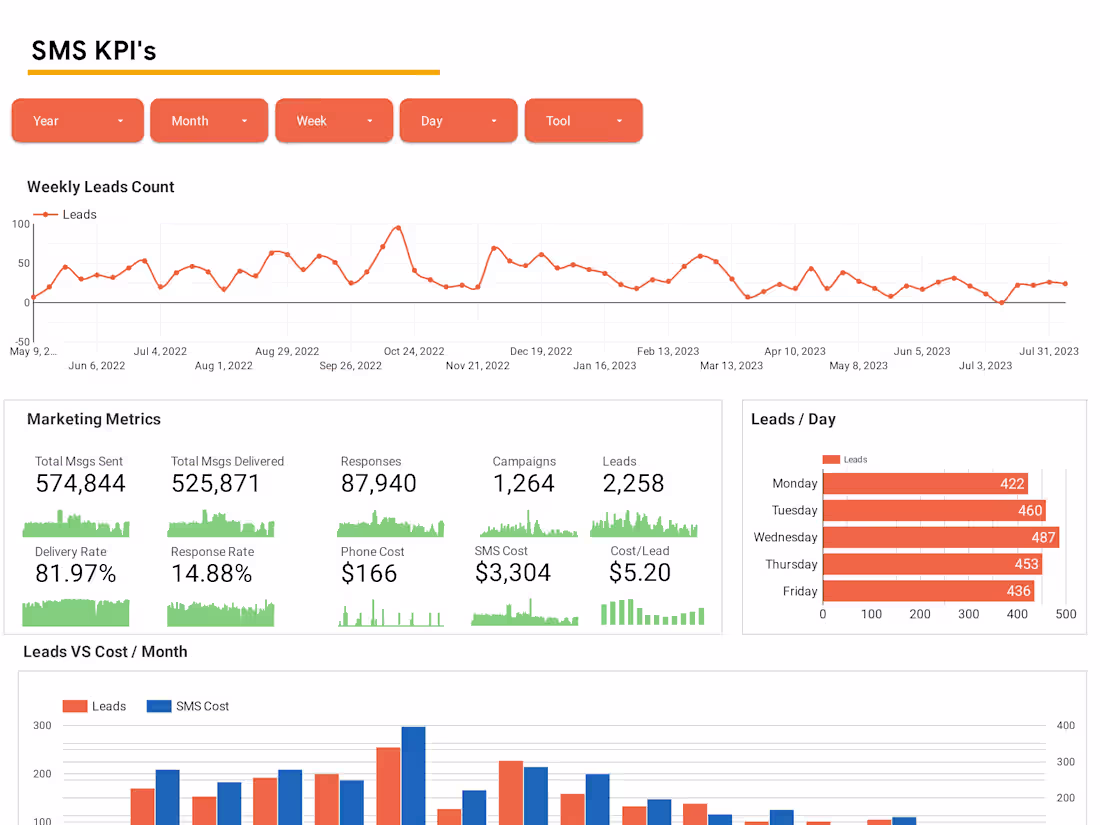
Customized Data Dashboards
Create interactive and visually appealing dashboards tailored to your client's specific data needs.
Include key performance indicators (KPIs), trends, and insights for quick decision-making.
Reports and Summaries
Generate comprehensive reports summarizing key findings, trends, and insights from the data analysis.
Provide clear and actionable recommendations based on the analysis results.
Exploratory Data Analysis (EDA)
Conduct exploratory data analysis to uncover patterns, outliers, and relationships within the dataset.
Visualize data distributions, correlations, and other relevant insights using appropriate charts and graphs.
Data Quality Assessment and Improvement:
Assess the quality of the data and identify potential data issues or inconsistencies.
Recommend data cleaning and improvement strategies to enhance data accuracy and reliability.
Abhishek's other services

Starting at$6 /hr
Tags
Microsoft Excel
Microsoft Power BI
Data Analyst
Data Visualizer
Product Data Analyst
Service provided by
Abhishek Gulbhile India
Make Data Make Sense!Abhishek Gulbhile
Starting at$6 /hr
Tags
Microsoft Excel
Microsoft Power BI
Data Analyst
Data Visualizer
Product Data Analyst
I offer comprehensive Data Visualization and Analysis services tailored to your specific needs. With expertise in creating interactive dashboards, visual presentations, and insightful reports, I help transform complex data into actionable insights. What sets me apart is my ability to not only visualize data effectively but also provide clear interpretations and actionable recommendations, empowering you to make informed decisions and drive success in your business.
What's included
Customized Data Dashboards
Create interactive and visually appealing dashboards tailored to your client's specific data needs.
Include key performance indicators (KPIs), trends, and insights for quick decision-making.
Reports and Summaries
Generate comprehensive reports summarizing key findings, trends, and insights from the data analysis.
Provide clear and actionable recommendations based on the analysis results.
Exploratory Data Analysis (EDA)
Conduct exploratory data analysis to uncover patterns, outliers, and relationships within the dataset.
Visualize data distributions, correlations, and other relevant insights using appropriate charts and graphs.
Data Quality Assessment and Improvement:
Assess the quality of the data and identify potential data issues or inconsistencies.
Recommend data cleaning and improvement strategies to enhance data accuracy and reliability.
Abhishek's other services
$6 /hr