
Data Visualization & DashboardsCiro
I turn complex datasets into clear, compelling visuals that make insights easy to understand and act on. Using Python (Matplotlib, Seaborn, Folium) alongside interactive tools like Power BI, D3.js, and three.js, I deliver reusable scripts, dashboards, and visual storytelling tailored to your needs. My async‑first workflow ensures you get professional, analysis‑ready visuals without meetings or friction.
What's included
Visualization Package (Charts & Graphs)
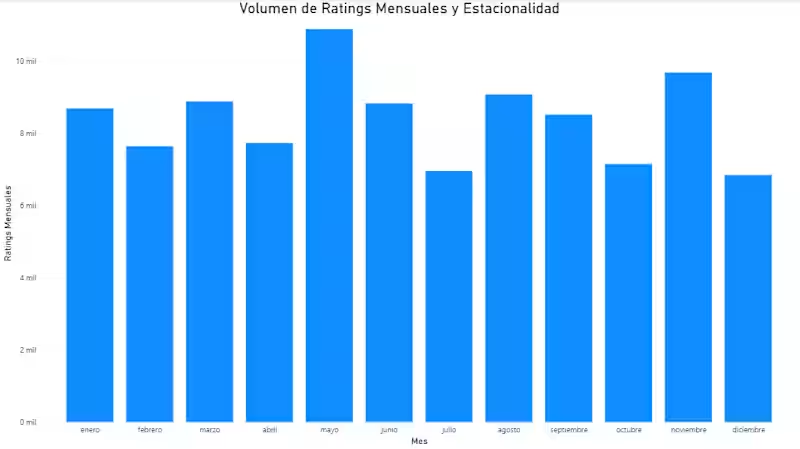
A curated set of static and statistical plots (Matplotlib/Seaborn) that highlight trends, anomalies, and key metrics in your dataset.
Interactive Dashboard
A dynamic dashboard built with Power BI, D3.js, or three.js, enabling stakeholders to filter, drill down, and explore data in real time.
Reusable Visualization Script (Python)
A Python script that generates reproducible charts and plots, ensuring automation and scalability for future datasets.
Documentation & Usage Guide
A clear README or guide explaining the visualization process, tools used, and instructions for updating or extending the visuals. This ensures transparency and ease of reuse.
FAQs
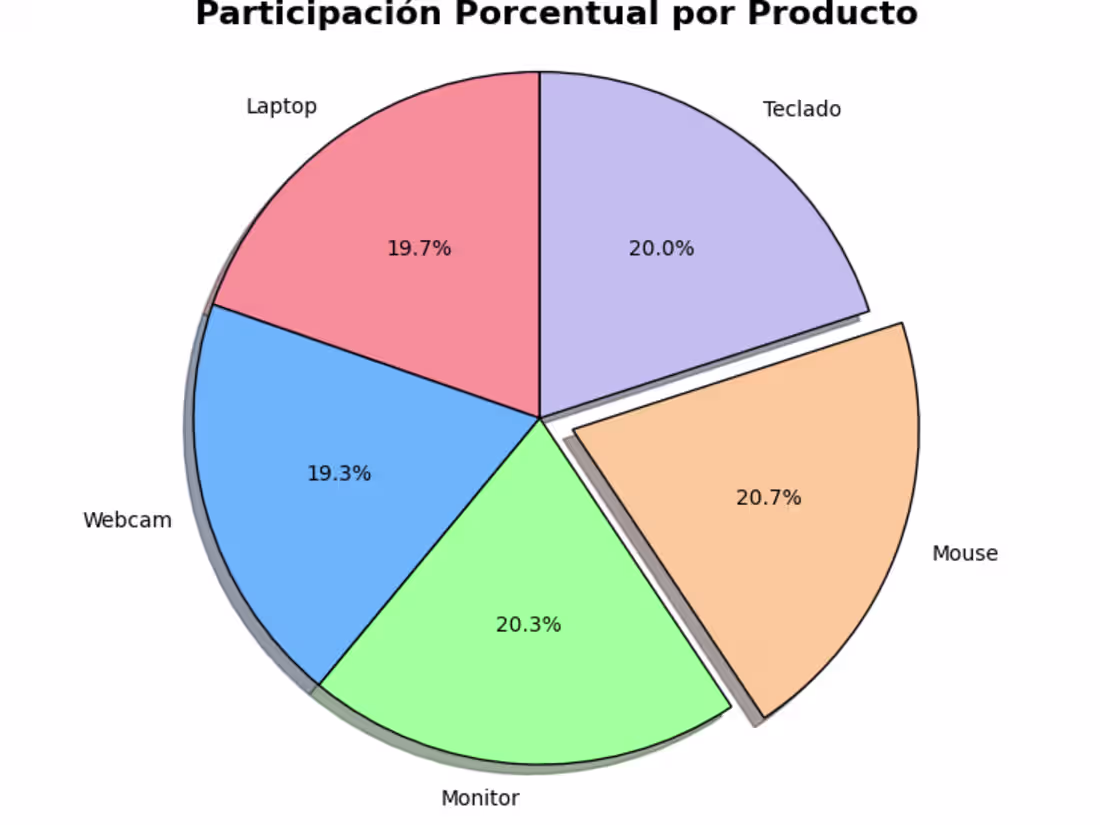
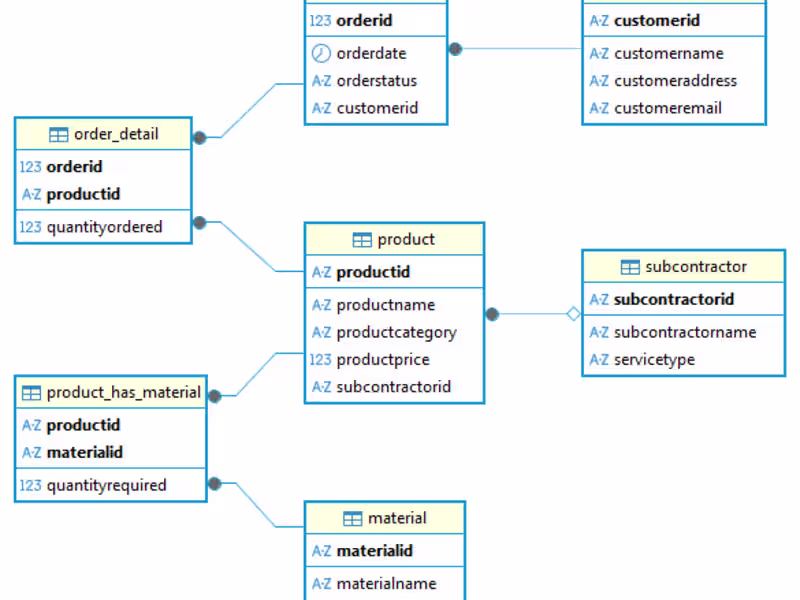
Example work
Ciro's other services
Starting at$25
Duration1 week
Tags
D3.js
Matplotlib
Microsoft Power BI
seaborn
three.js
Data Analyst
Data Scientist
Data Visualizer
Service provided by
Ciro Buenos Aires, Argentina
- 267
- Followers
Data Visualization & DashboardsCiro
Starting at$25
Duration1 week
Tags
D3.js
Matplotlib
Microsoft Power BI
seaborn
three.js
Data Analyst
Data Scientist
Data Visualizer
I turn complex datasets into clear, compelling visuals that make insights easy to understand and act on. Using Python (Matplotlib, Seaborn, Folium) alongside interactive tools like Power BI, D3.js, and three.js, I deliver reusable scripts, dashboards, and visual storytelling tailored to your needs. My async‑first workflow ensures you get professional, analysis‑ready visuals without meetings or friction.
What's included
Visualization Package (Charts & Graphs)
A curated set of static and statistical plots (Matplotlib/Seaborn) that highlight trends, anomalies, and key metrics in your dataset.
Interactive Dashboard
A dynamic dashboard built with Power BI, D3.js, or three.js, enabling stakeholders to filter, drill down, and explore data in real time.
Reusable Visualization Script (Python)
A Python script that generates reproducible charts and plots, ensuring automation and scalability for future datasets.
Documentation & Usage Guide
A clear README or guide explaining the visualization process, tools used, and instructions for updating or extending the visuals. This ensures transparency and ease of reuse.
FAQs
Example work
Ciro's other services
$25