
Custom Analytics Dashboard DevelopmentAri Harrison
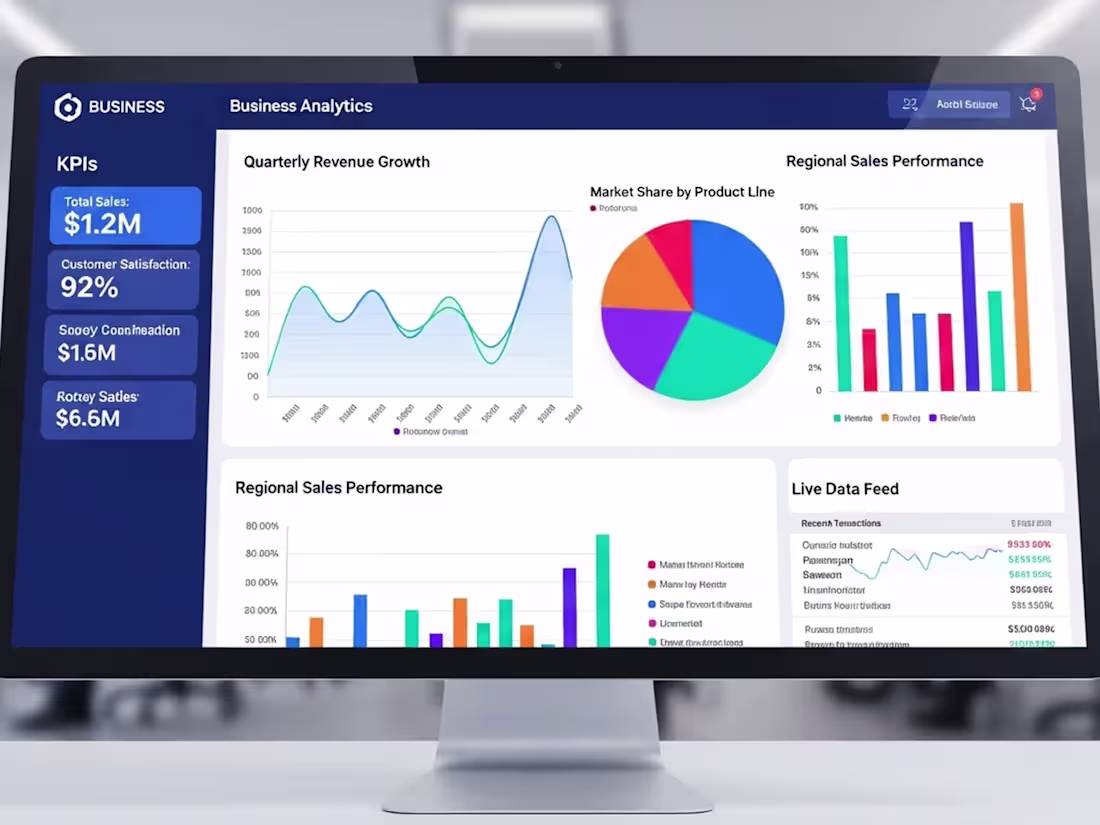
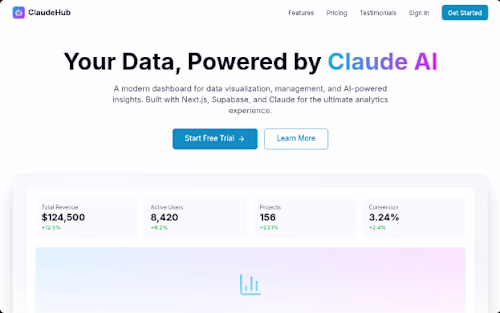
I transform your scattered spreadsheets and data sources into a single, clear, and interactive dashboard. You get real-time visualizations of key metrics (KPIs) that your team can use to make faster, data-driven decisions. I specialize in building these with modern tools like Next.js and Supabase, ensuring they are fast, secure, and tailored to your unique metrics.
What's included
Live Interactive Dashboard
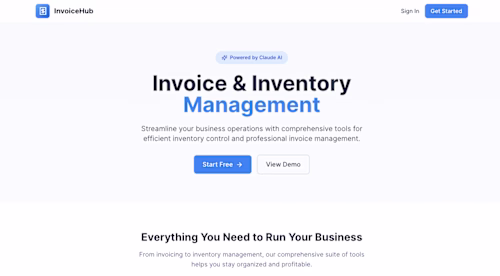
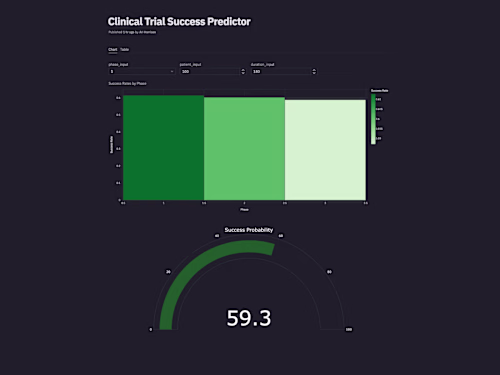
A password-protected dashboard with 3-5 key data visualizations (e.g., line chart, bar chart, KPI metrics).
Format: Live, hosted web application (URL).
Details: Real-time or scheduled data refresh. 2 rounds of revisions on chart types and layout.
Data Pipeline & Integration
Connected data source with clean, queryable data structure for the dashboard.
Format: Configured Supabase database or API connection within the source code.
Details: Automated pipeline (via cron or trigger) to populate the dashboard data.
Admin & User Guide
Documentation for adding users, interpreting data, and modifying filters.
Format: README.md in the code repository and a 30-minute training walkthrough.
Details: Explains dashboard logic, user roles (admin/viewer), and how to export data.
FAQs
Example work


Starting at$2,995
Duration4 weeks
Tags
Next.js
Shadcn UI
Supabase
Tailwind CSS
Vercel
Data Visualizer
DevOps Engineer
Fullstack Engineer
Service provided by
Ari Harrison proSan Francisco, USA
- $1k+
- Earned
- 7
- Paid projects
- 27
- Followers
Custom Analytics Dashboard DevelopmentAri Harrison
Starting at$2,995
Duration4 weeks
Tags
Next.js
Shadcn UI
Supabase
Tailwind CSS
Vercel
Data Visualizer
DevOps Engineer
Fullstack Engineer
I transform your scattered spreadsheets and data sources into a single, clear, and interactive dashboard. You get real-time visualizations of key metrics (KPIs) that your team can use to make faster, data-driven decisions. I specialize in building these with modern tools like Next.js and Supabase, ensuring they are fast, secure, and tailored to your unique metrics.
What's included
Live Interactive Dashboard
A password-protected dashboard with 3-5 key data visualizations (e.g., line chart, bar chart, KPI metrics).
Format: Live, hosted web application (URL).
Details: Real-time or scheduled data refresh. 2 rounds of revisions on chart types and layout.
Data Pipeline & Integration
Connected data source with clean, queryable data structure for the dashboard.
Format: Configured Supabase database or API connection within the source code.
Details: Automated pipeline (via cron or trigger) to populate the dashboard data.
Admin & User Guide
Documentation for adding users, interpreting data, and modifying filters.
Format: README.md in the code repository and a 30-minute training walkthrough.
Details: Explains dashboard logic, user roles (admin/viewer), and how to export data.
FAQs
Example work
$2,995