
I will create powerful dashboards in power bi and tableauMuhammad Awais Quarni
*PLEASE INBOX BEFORE ORDERING!*
With over 3 years of experience in Analytics and Business Intelligence, I have been employed as a Data Analyst. My role involves assisting clients in enhancing their decision-making capabilities by proficiently analyzing their data.
Suppose you want charts, storylines, or complete dashboards. I'm here to help you out! :)
Here is a List Of Services That I Offer:
Create Bar Charts, Area Charts, Maps, Scatter Plots, Pie Charts, Treemaps, Line Charts
Create a Donut chart, Gauge chart, Waterfall chart,
Create Interactive Dashboards and Storylines
Data Preparation Joining and Blending or Cross database joins.
Create Table Calculations
Work with Parameters
Exploratory Data Analysis
Create Dual Axis Charts
Create Calculated Fields
Tableau Dashboard
Creating Data Extracts in Tableau
Adding Actions to Dashboards (filters & highlighting)
Delivering Proof of Concept, Wireframe based on dummy dataset
Tableau Resume
️ Data Cleaning, Modelling, and Transformation
Tools and Technologies which I use:
Tableau
Power BI
Excel
WEKA
Jupyter Notebook
Python
Plotly
Plotly Dash
Seaborn
Matplotlib
What's included
Power Bi, Tableau and Google Data Studio dashboard
Area Chart
Bar Chart
Box and Whisker Plots
Bullet Chart
Scatter Plot
Pie Chart
Bubble Chart
Line Chart
Histogram
Heat Map
Geolocation
Forecasting
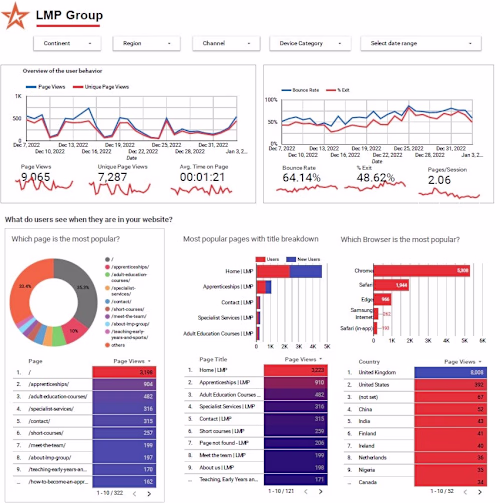
Example work
Muhammad Awais 's other services

Starting at$50
Tags
Microsoft Excel
Microsoft Power BI
Python
R
Tableau
Data Analyst
Data Engineer
Data Visualizer
Service provided by
Muhammad Awais Quarni Pakistan
I will create powerful dashboards in power bi and tableauMuhammad Awais Quarni
Starting at$50
Tags
Microsoft Excel
Microsoft Power BI
Python
R
Tableau
Data Analyst
Data Engineer
Data Visualizer
*PLEASE INBOX BEFORE ORDERING!*
With over 3 years of experience in Analytics and Business Intelligence, I have been employed as a Data Analyst. My role involves assisting clients in enhancing their decision-making capabilities by proficiently analyzing their data.
Suppose you want charts, storylines, or complete dashboards. I'm here to help you out! :)
Here is a List Of Services That I Offer:
Create Bar Charts, Area Charts, Maps, Scatter Plots, Pie Charts, Treemaps, Line Charts
Create a Donut chart, Gauge chart, Waterfall chart,
Create Interactive Dashboards and Storylines
Data Preparation Joining and Blending or Cross database joins.
Create Table Calculations
Work with Parameters
Exploratory Data Analysis
Create Dual Axis Charts
Create Calculated Fields
Tableau Dashboard
Creating Data Extracts in Tableau
Adding Actions to Dashboards (filters & highlighting)
Delivering Proof of Concept, Wireframe based on dummy dataset
Tableau Resume
️ Data Cleaning, Modelling, and Transformation
Tools and Technologies which I use:
Tableau
Power BI
Excel
WEKA
Jupyter Notebook
Python
Plotly
Plotly Dash
Seaborn
Matplotlib
What's included
Power Bi, Tableau and Google Data Studio dashboard
Area Chart
Bar Chart
Box and Whisker Plots
Bullet Chart
Scatter Plot
Pie Chart
Bubble Chart
Line Chart
Histogram
Heat Map
Geolocation
Forecasting
Example work
Muhammad Awais 's other services
$50