
Dynamic Data Visualization with Power BI and ExcelKILLIAN SARSAH
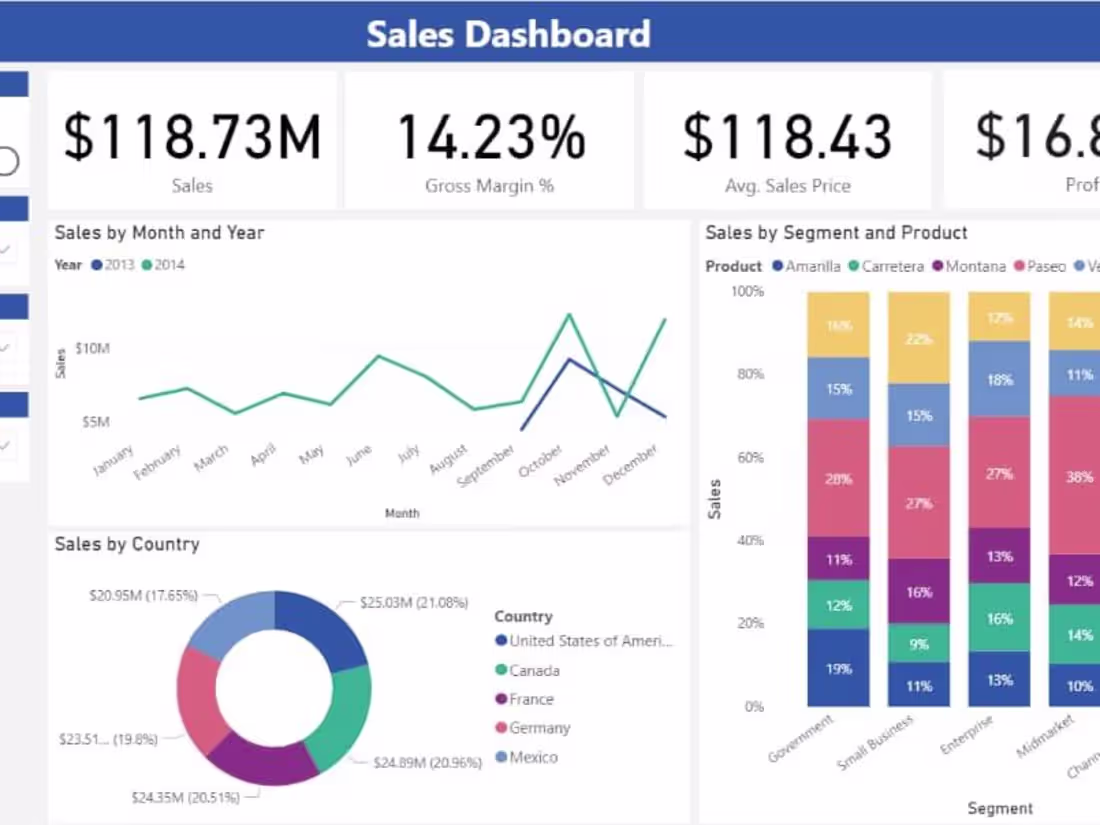
I offer expert data visualization services using Power BI and Excel to create dynamic, interactive dashboards and insightful reports. My unique approach combines detailed data analysis with customized visual design, providing clear, actionable insights tailored to your needs.
What's included
Data Visualization Reports
Comprehensive reports featuring detailed charts, graphs, and visualizations that highlight trends, patterns, and insights derived from your data.


Starting at$25.25
Duration1 day
Tags
Matplotlib
Microsoft PowerPoint
Tableau
TensorFlow
three.js
Data Analyst
Data Scientist
Data Visualizer
Service provided by
KILLIAN SARSAH Ghana
Dynamic Data Visualization with Power BI and ExcelKILLIAN SARSAH
Starting at$25.25
Duration1 day
Tags
Matplotlib
Microsoft PowerPoint
Tableau
TensorFlow
three.js
Data Analyst
Data Scientist
Data Visualizer
I offer expert data visualization services using Power BI and Excel to create dynamic, interactive dashboards and insightful reports. My unique approach combines detailed data analysis with customized visual design, providing clear, actionable insights tailored to your needs.
What's included
Data Visualization Reports
Comprehensive reports featuring detailed charts, graphs, and visualizations that highlight trends, patterns, and insights derived from your data.
$25.25