
Data Analysis: Growth, Efficiency & Strategic Decision With DataAbdul-wali Abubakar
I help businesses solve their toughest challenges with data-driven insights. By combining AI-powered analytics with clear communication, I deliver:
Actionable recommendations to improve decision-making.
Data-driven strategies for growth and efficiency.
Solutions that uncover hidden opportunities and optimize operations.
What's included
Data Visualization and Reporting.
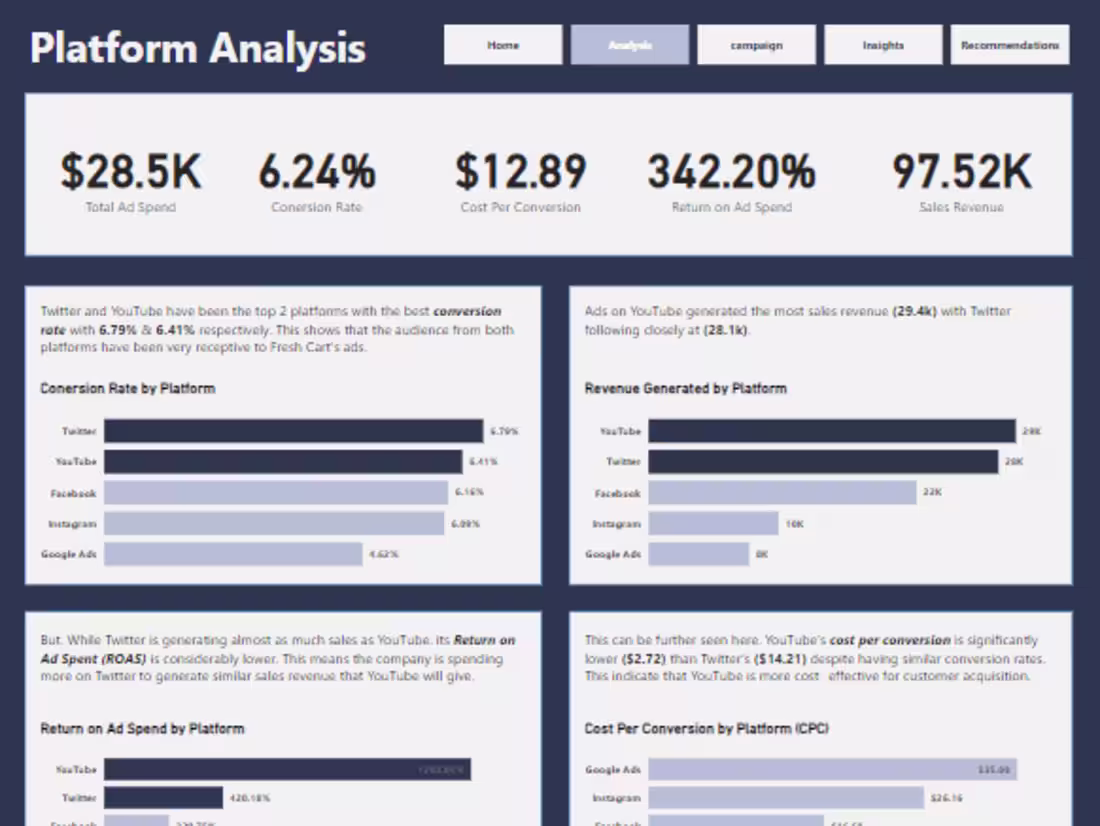
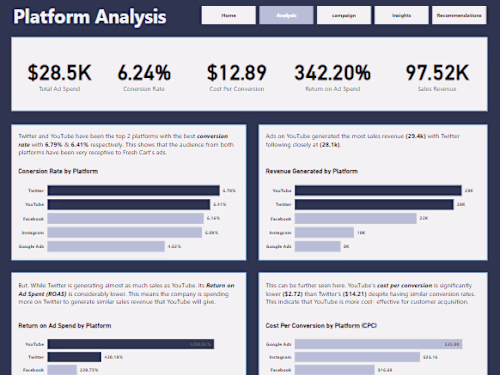
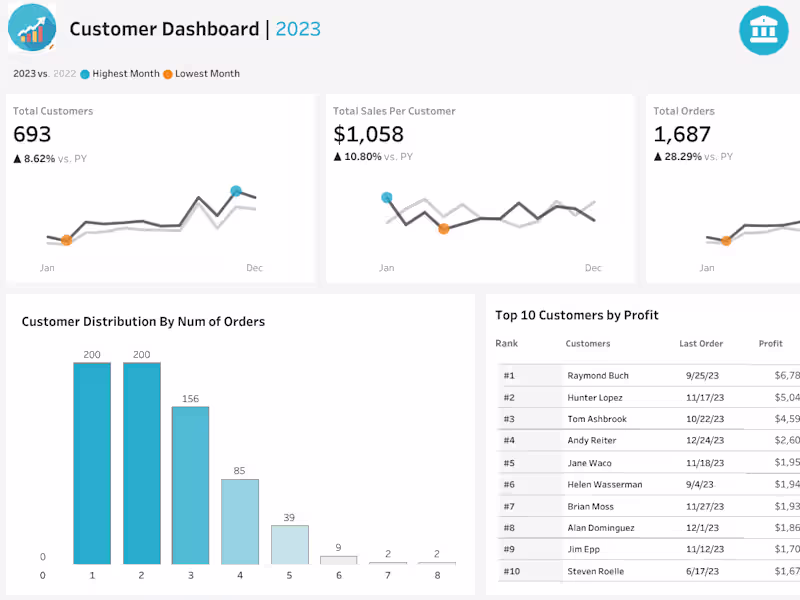
Transforming data into meaningful visuals (Charts, graphs, and dashboards that make complex information easy to understand),
Communicating insights effectively by presenting findings in a clear, concise, and engaging manner to stakeholders,
Driving informed decision-making a providing a visual foundation for understanding trends, patterns, and anomalies in data.
Data-Driven Recommendations and Decision Making.
Improve decision-making accuracy by reducing reliance on gut feelings and make more informed choices based on evidence,
Identify new opportunities by Uncovering hidden trends and patterns to identify new markets, products, and services,
Optimizing operations by streamline processes, improving efficiency, and reducing costs based on data-driven insights.
Abdul-wali's other services
Contact for pricing
Tags
Azure
Matplotlib
Microsoft Excel
Microsoft Power BI
Tableau
Business Analyst
Data Analyst
Data Visualizer
Service provided by
Abdul-wali Abubakar Onitsha, Nigeria
Data Analysis: Growth, Efficiency & Strategic Decision With DataAbdul-wali Abubakar
Contact for pricing
Tags
Azure
Matplotlib
Microsoft Excel
Microsoft Power BI
Tableau
Business Analyst
Data Analyst
Data Visualizer
I help businesses solve their toughest challenges with data-driven insights. By combining AI-powered analytics with clear communication, I deliver:
Actionable recommendations to improve decision-making.
Data-driven strategies for growth and efficiency.
Solutions that uncover hidden opportunities and optimize operations.
What's included
Data Visualization and Reporting.
Transforming data into meaningful visuals (Charts, graphs, and dashboards that make complex information easy to understand),
Communicating insights effectively by presenting findings in a clear, concise, and engaging manner to stakeholders,
Driving informed decision-making a providing a visual foundation for understanding trends, patterns, and anomalies in data.
Data-Driven Recommendations and Decision Making.
Improve decision-making accuracy by reducing reliance on gut feelings and make more informed choices based on evidence,
Identify new opportunities by Uncovering hidden trends and patterns to identify new markets, products, and services,
Optimizing operations by streamline processes, improving efficiency, and reducing costs based on data-driven insights.
Abdul-wali's other services
Contact for pricing