
Interactive Data VisualizationsAishwarya Mahajan
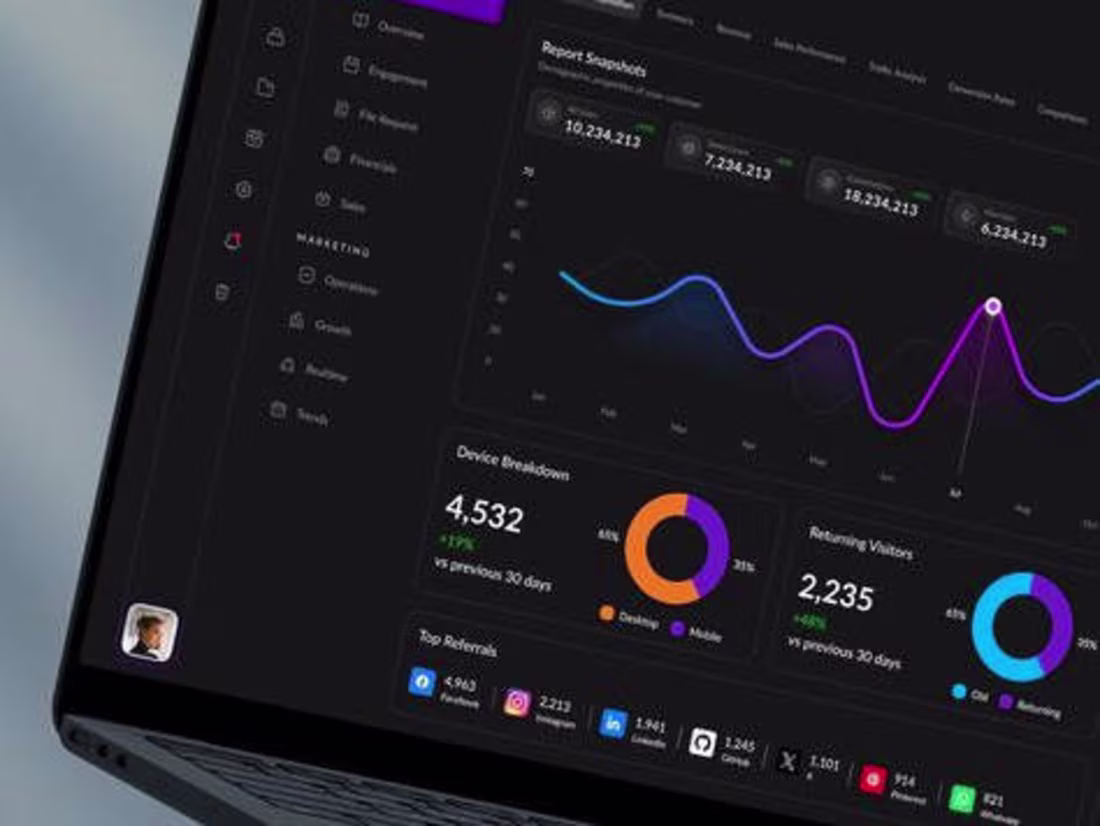
A suite of engaging visualizations, including bar charts, line graphs, and dashboards, designed to highlight key trends and insights from the analysis. These interactive tools enable stakeholders to explore data dynamically, facilitating informed decision-making and enhancing communication through clear annotations and explanations.
What's included
Data Visualizations
A set of interactive graphs, charts, and dashboards designed to clearly represent key trends and insights from the analysis, enabling stakeholders to easily interpret the data and make informed decisions.
Aishwarya's other services
Contact for pricing
Tags
Matplotlib
Microsoft Power BI
Tableau
Data Analyst
Data Scientist
Data Visualizer
Service provided by
Aishwarya Mahajan Pune, India
- 1
- Followers
Interactive Data VisualizationsAishwarya Mahajan
Contact for pricing
Tags
Matplotlib
Microsoft Power BI
Tableau
Data Analyst
Data Scientist
Data Visualizer
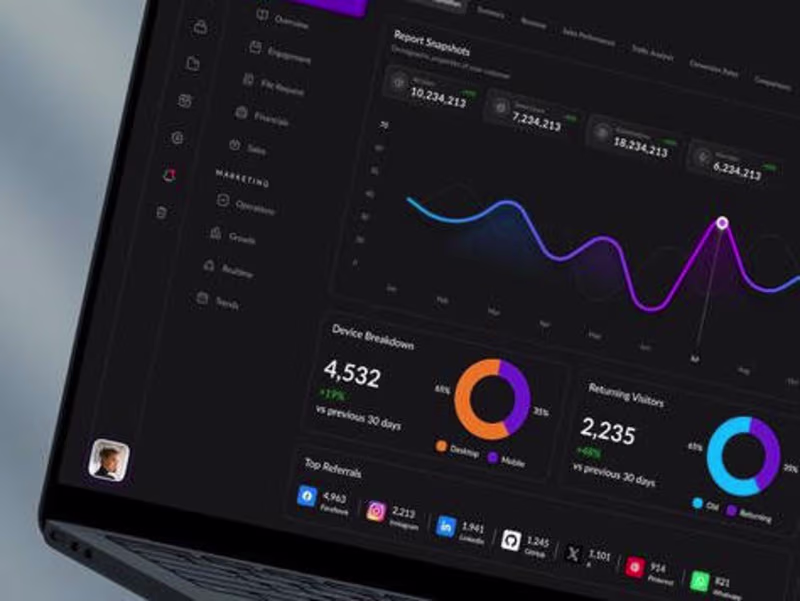
A suite of engaging visualizations, including bar charts, line graphs, and dashboards, designed to highlight key trends and insights from the analysis. These interactive tools enable stakeholders to explore data dynamically, facilitating informed decision-making and enhancing communication through clear annotations and explanations.
What's included
Data Visualizations
A set of interactive graphs, charts, and dashboards designed to clearly represent key trends and insights from the analysis, enabling stakeholders to easily interpret the data and make informed decisions.
Aishwarya's other services
Contact for pricing