
Storytelling Designed for Business GrowthT-R-I Visual Communications
We create data visualizations that turn complexity into clarity—helping teams see patterns, not just numbers. Our work combines design precision with narrative flow, so every chart or dashboard tells a story that supports decision-making and brand coherence. What makes us unique is our hybrid background in fintech strategy and visual storytelling, allowing us to bridge analytical depth with design that resonates.
What's included
Inforgraphics and Data Visualizations
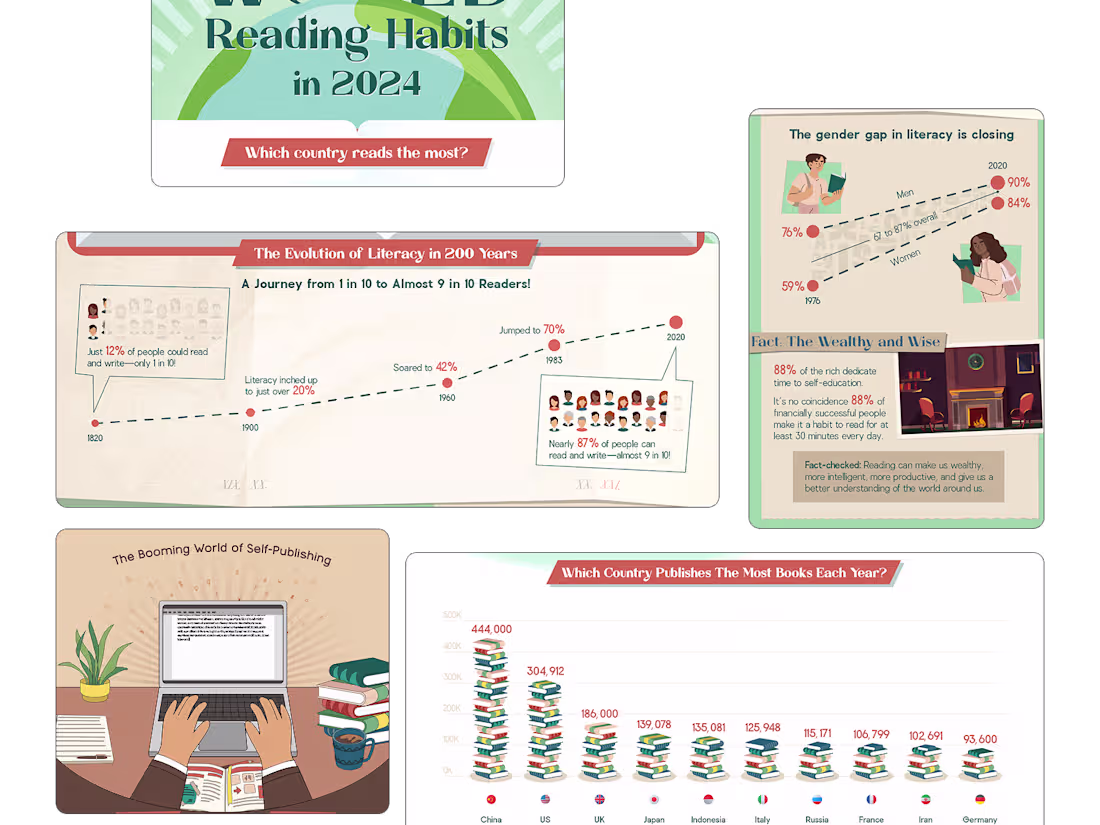
Translating raw data into visuals that inform and inspire. We design charts, infographics, and visual frameworks that reveal patterns, clarify insights, and make data feel human—consistent with your brand language and story.
Contact for pricing
Tags
Tableau


Data Analyst
Data Scientist
Data Visualizer
Service provided by
T-R-I Visual Communications New York, USA
- 1
- Followers
Storytelling Designed for Business GrowthT-R-I Visual Communications
We create data visualizations that turn complexity into clarity—helping teams see patterns, not just numbers. Our work combines design precision with narrative flow, so every chart or dashboard tells a story that supports decision-making and brand coherence. What makes us unique is our hybrid background in fintech strategy and visual storytelling, allowing us to bridge analytical depth with design that resonates.
What's included
Inforgraphics and Data Visualizations
Translating raw data into visuals that inform and inspire. We design charts, infographics, and visual frameworks that reveal patterns, clarify insights, and make data feel human—consistent with your brand language and story.
Contact for pricing