
Turn Your Data into Actionable Insights (Reporting & Analysis)Aarsh Vyas
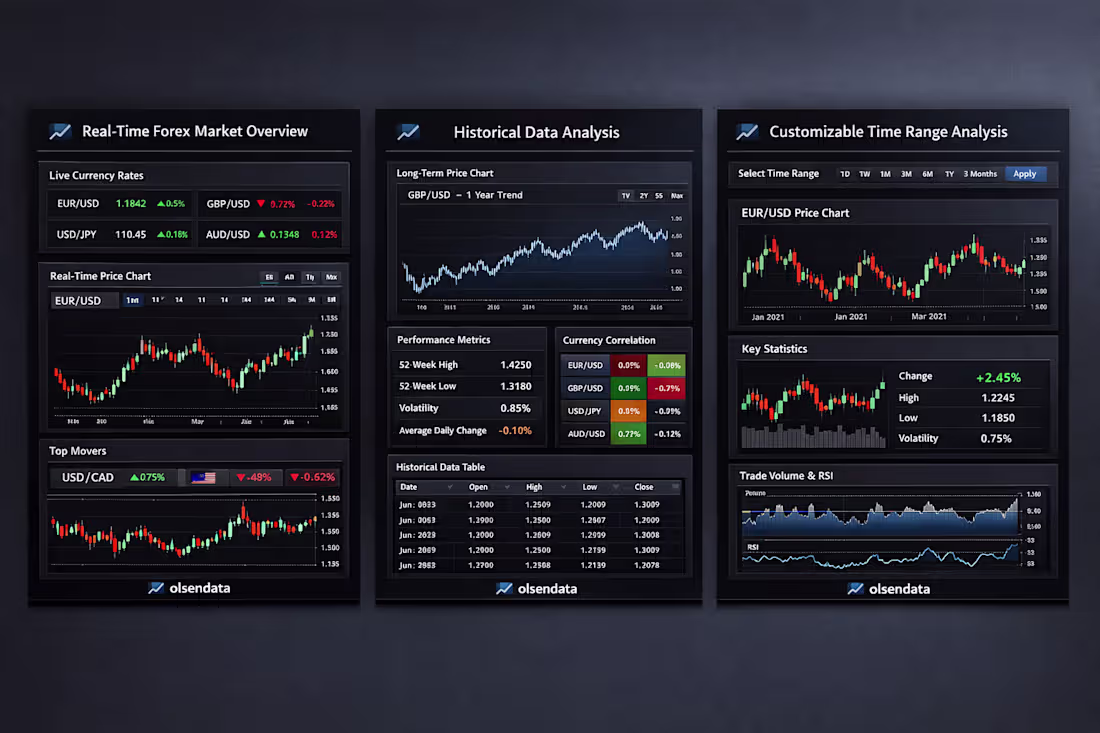
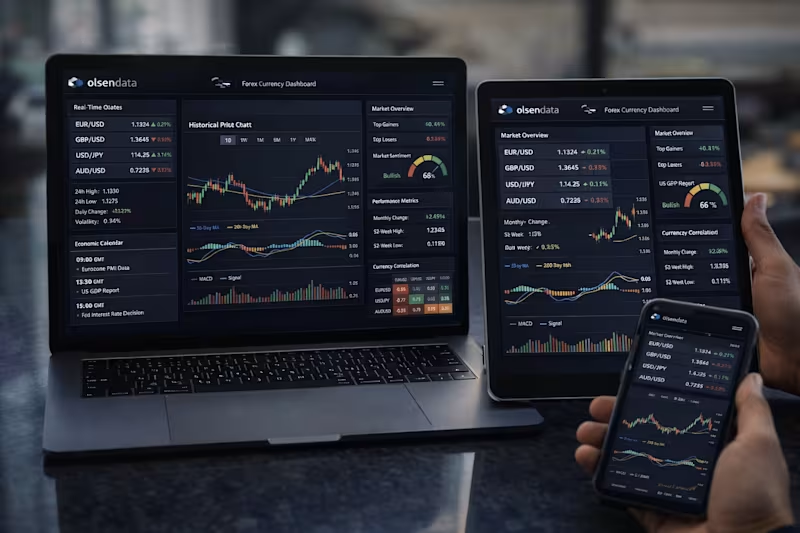
I help businesses turn raw data into clear, actionable insights that drive smarter decisions and measurable growth. If you already have data but struggle to understand what it means — I analyze, structure, and present it through intuitive dashboards and detailed reports. Using tools like Power BI and Looker Studio, I create visual reports that highlight key trends, performance metrics, and opportunities, so you can quickly identify what’s working and what needs improvement.
My focus is not just on charts, but on delivering meaningful insights that help you optimize campaigns, improve operations, and increase ROI.
✅ What You’ll Get
Data cleaning & structured analysis
KPI tracking & performance reports
Interactive dashboards (Power BI / Looker Studio)
Trend analysis & insights
Business recommendations based on data
Easy-to-understand visual reports
Starting at$1,500
Duration4 weeks
Tags
Looker Studio
Microsoft Power BI
SQL
Data Analyst
Data Visualizer
Marketing Analytics Specialist
Business Intelligence
dashboard development
KPI REPORTING
Service provided by
Aarsh Vyas proAhmedabad, India
Turn Your Data into Actionable Insights (Reporting & Analysis)Aarsh Vyas
Starting at$1,500
Duration4 weeks
Tags
Looker Studio
Microsoft Power BI
SQL
Data Analyst
Data Visualizer
Marketing Analytics Specialist
Business Intelligence
dashboard development
KPI REPORTING
I help businesses turn raw data into clear, actionable insights that drive smarter decisions and measurable growth. If you already have data but struggle to understand what it means — I analyze, structure, and present it through intuitive dashboards and detailed reports. Using tools like Power BI and Looker Studio, I create visual reports that highlight key trends, performance metrics, and opportunities, so you can quickly identify what’s working and what needs improvement.
My focus is not just on charts, but on delivering meaningful insights that help you optimize campaigns, improve operations, and increase ROI.
✅ What You’ll Get
Data cleaning & structured analysis
KPI tracking & performance reports
Interactive dashboards (Power BI / Looker Studio)
Trend analysis & insights
Business recommendations based on data
Easy-to-understand visual reports
$1,500