
Business analystMohammad Hayat

I offer expert data analysis and visualization services, transforming raw data into actionable insights that drive decision-making. With a strong background in Power BI and Python, I deliver clean, well-documented solutions that are tailored to your specific needs. My focus on clarity and simplicity ensures that complex data is accessible and understandable for all stakeholders.
What's included
Detailed Data Analysis Report
Comprehensive report including insights, trends, and key findings.
Cleaned and Processed Data
Dataset refined and ready for further use or analysis.
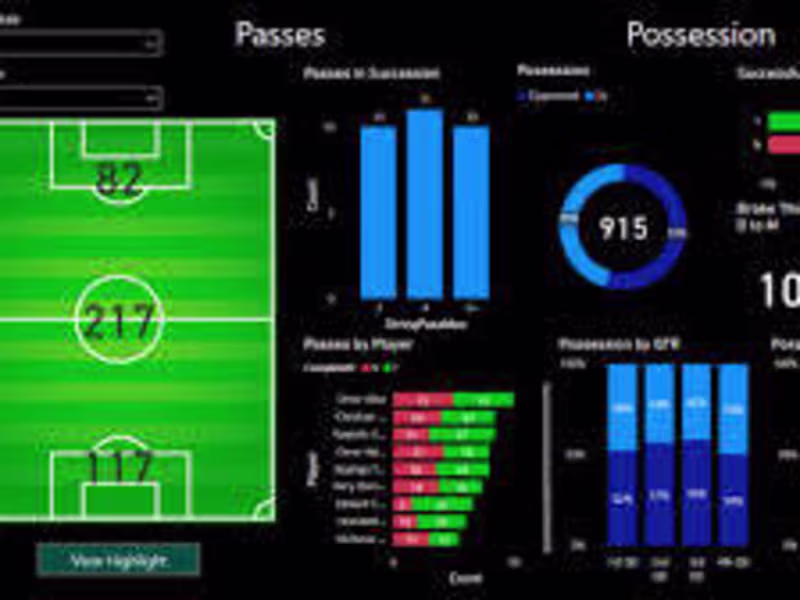
Power BI Dashboard
Interactive and dynamic dashboard showcasing the data insights with filters for customized views.
Visualizations
Charts and graphs that visually represent the key metrics and trends.
Executive Summary
A concise summary highlighting the project’s main outcomes and actionable insights.
Final Presentation
A presentation summarizing the entire project and its findings, ready to be shared with stakeholders.
Mohammad's other services
Contact for pricing
Tags
MATLAB
Microsoft Excel
pandas
Tableau
Data Analyst
Data Modelling Analyst
Data Scientist
Service provided by
Mohammad Hayat Srinagar
Business analystMohammad Hayat
Contact for pricing
Tags
MATLAB
Microsoft Excel
pandas
Tableau
Data Analyst
Data Modelling Analyst
Data Scientist
I offer expert data analysis and visualization services, transforming raw data into actionable insights that drive decision-making. With a strong background in Power BI and Python, I deliver clean, well-documented solutions that are tailored to your specific needs. My focus on clarity and simplicity ensures that complex data is accessible and understandable for all stakeholders.
What's included
Detailed Data Analysis Report
Comprehensive report including insights, trends, and key findings.
Cleaned and Processed Data
Dataset refined and ready for further use or analysis.
Power BI Dashboard
Interactive and dynamic dashboard showcasing the data insights with filters for customized views.
Visualizations
Charts and graphs that visually represent the key metrics and trends.
Executive Summary
A concise summary highlighting the project’s main outcomes and actionable insights.
Final Presentation
A presentation summarizing the entire project and its findings, ready to be shared with stakeholders.
Mohammad's other services
Contact for pricing