
Kubernetes Observability Stack with Prometheus, Grafana and LokiAshref Gamoudi
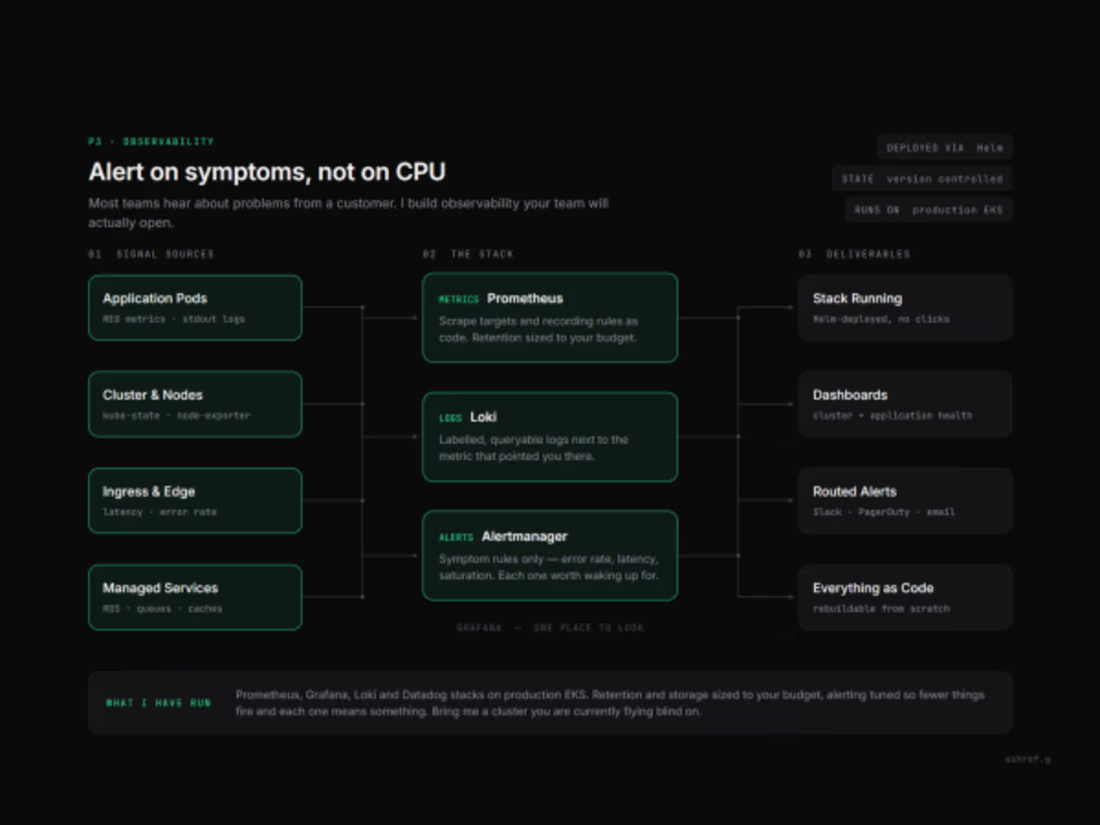
Most teams find out about problems from a customer. The monitoring exists, but it alerts on CPU rather than on anything a user would notice, so the alerts get muted and the dashboards get ignored.
I build observability your team will actually open. Prometheus for metrics, Loki for logs, Grafana as the single place to look, all deployed through Helm and version controlled rather than clicked together by hand.
The part that matters is the alerting. I alert on symptoms, meaning error rates, latency, and saturation that a user would feel, instead of on every resource threshold. Fewer alerts, each one worth waking up for. Then I trigger each alert on purpose to prove the routing works end to end.
WHAT YOU RECEIVE
The full stack deployed and running, dashboards for cluster and application health, alert rules routed to Slack, PagerDuty or email, retention and storage sized to your budget, and everything committed as code so it can be rebuilt from scratch.
SCOPE LEVELS
- Base: $1,500, 6 days. One cluster, Prometheus and Grafana, core cluster
dashboards, deployed via Helm and IaC.
- Extended: $2,200, 9 days. Adds application level dashboards, log aggregation with Loki, and alert rules with routing.
- Full: $3,200, 14 days. Up to three clusters, SLO dashboards with error budgets, distributed tracing, and an on call runbook.
Commonly added: Grafana Cloud or Datadog instead of self hosted, long term metrics storage with Thanos or Mimir, PagerDuty escalation policy setup, team training on reading the dashboards.
I have run Prometheus, Grafana, Loki and Datadog stacks on production EKS. Bring me a cluster you are currently flying blind on.
TO GET STARTED
message me with where the cluster runs, what is monitoring it today if anything, and the two or three services whose failure hurts most. Alerting gets built around those first.
FAQs
Starting at$1,500
Duration9 days
Tags
Grafana

Helm
Kubernetes
Prometheus

Loki
Monitoring
Observability
SRE
Service provided by
Ashref Gamoudi Tunis, Tunisia
- $1k+
- Earned
- 2
- Paid projects
- 4.33
- Rating
- 9
- Followers
Kubernetes Observability Stack with Prometheus, Grafana and LokiAshref Gamoudi
Starting at$1,500
Duration9 days
Tags
Grafana
Helm
Kubernetes
Prometheus
Loki
Monitoring
Observability
SRE
Most teams find out about problems from a customer. The monitoring exists, but it alerts on CPU rather than on anything a user would notice, so the alerts get muted and the dashboards get ignored.
I build observability your team will actually open. Prometheus for metrics, Loki for logs, Grafana as the single place to look, all deployed through Helm and version controlled rather than clicked together by hand.
The part that matters is the alerting. I alert on symptoms, meaning error rates, latency, and saturation that a user would feel, instead of on every resource threshold. Fewer alerts, each one worth waking up for. Then I trigger each alert on purpose to prove the routing works end to end.
WHAT YOU RECEIVE
The full stack deployed and running, dashboards for cluster and application health, alert rules routed to Slack, PagerDuty or email, retention and storage sized to your budget, and everything committed as code so it can be rebuilt from scratch.
SCOPE LEVELS
- Base: $1,500, 6 days. One cluster, Prometheus and Grafana, core cluster
dashboards, deployed via Helm and IaC.
- Extended: $2,200, 9 days. Adds application level dashboards, log aggregation with Loki, and alert rules with routing.
- Full: $3,200, 14 days. Up to three clusters, SLO dashboards with error budgets, distributed tracing, and an on call runbook.
Commonly added: Grafana Cloud or Datadog instead of self hosted, long term metrics storage with Thanos or Mimir, PagerDuty escalation policy setup, team training on reading the dashboards.
I have run Prometheus, Grafana, Loki and Datadog stacks on production EKS. Bring me a cluster you are currently flying blind on.
TO GET STARTED
message me with where the cluster runs, what is monitoring it today if anything, and the two or three services whose failure hurts most. Alerting gets built around those first.
FAQs
$1,500