

Data Storytelling That Inspires Growth 📊🗣️

Starting at
$
50
/hrAbout this service
Summary
I offer tailored data visualization and interactive dashboards that transform complex data into clear, actionable insights.
My approach combines data storytelling with powerful visuals, empowering businesses to make informed decisions quickly and confidently.
What sets me apart is my focus on making data not just understandable, but also engaging and impactful for strategic growth.
Process
1. Initial Consultation & Requirements Gathering 📝
We start by discussing your business goals, data challenges, and specific needs for dashboards and visualizations.
2. Data Assessment & Preparation 🧹
I assess your data sources and choose SQL if the data is stored in databases, or Excel if the data is in spreadsheets. I then clean, transform, and prepare the data to ensure accuracy and consistency.
3. Tableau Setup & Integration 🔌
I set up Tableau, integrate your data sources (whether from SQL or Excel), and ensure smooth data connections for efficient reporting and visualization.
4. Dashboard Design & Storyboarding 🎨
I design the layout and structure of your Tableau dashboard, creating wireframes or storyboards to ensure it aligns with your goals.
5. Data Visualization Creation in Tableau 📊
I use Tableau to create custom visualizations (charts, graphs, and infographics) that present your data in an engaging and insightful manner.
6. Data Storytelling Integration 📚
I incorporate data storytelling techniques into the Tableau dashboards, highlighting key insights and trends in a narrative format.
7. Client Review & Feedback 📋
I share the initial Tableau dashboard with you, gathering feedback to ensure it meets your expectations and goals.
8. Final Adjustments & Customization ✨
Based on your feedback, I make final adjustments to the design, layout, and functionality of the Tableau dashboard.
9. Ongoing Support & Updates 🔧
After delivery, I offer ongoing Tableau support for troubleshooting, maintenance, and updates as your data evolves or your needs change.
What's included
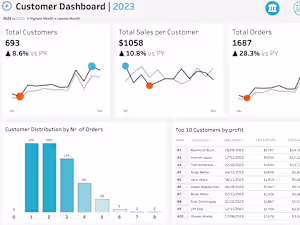
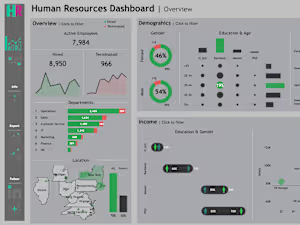
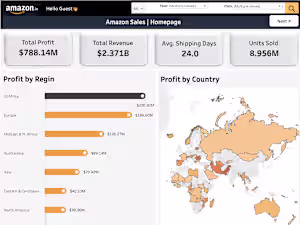
Interactive Dashboards 📊
Fully functional, interactive dashboards tailored to the client’s data and needs, allowing easy exploration and insights extraction.
Data Visualizations 📈
Custom charts, graphs, and infographics that simplify complex data, telling a clear and engaging story to guide decision-making.
Reports 📑
Detailed reports explaining the visualized data, insights, and recommendations for business decisions.

Skills and tools
Data Visualizer
Data Analyst
Product Data Analyst

Jupyter

Microsoft Excel

Python

Tableau

Visual Studio Code
Industries
Marketing
Sales