
Pixel-Perfect DashboardAlessia Musio
A dashboarding service is a specialized offering that focuses on creating interactive and informative dashboards to enable clients to visualize, analyze, and interpret complex data in a user-friendly manner. These dashboards serve as consolidated visual interfaces that provide real-time insights and actionable information, facilitating data-driven decision-making
What's included
Project Scope and Requirements Document
A detailed document outlining the project's objectives, target audience, data sources, and specific requirements for the dashboards.
Data Preparation and Integration
Gather, clean, and preprocess the necessary data from various sources to ensure that it is ready for visualization. This might involve data transformation, blending, and joining.
Dashboard Wireframes and Mockups
Create initial wireframes or mockups that outline the layout, arrangement of visualizations, and user interface elements within the dashboards.
Data Visualization Design
Develop a range of data visualizations, such as charts, graphs, maps, and tables, that effectively communicate insights. Choose appropriate visualization types to match the data and objectives.
Dashboard Creation
Build interactive dashboards using Tableau or Looker Studio's tools. Arrange visualizations logically, implement filters, parameters, and other interactive elements for user exploration.
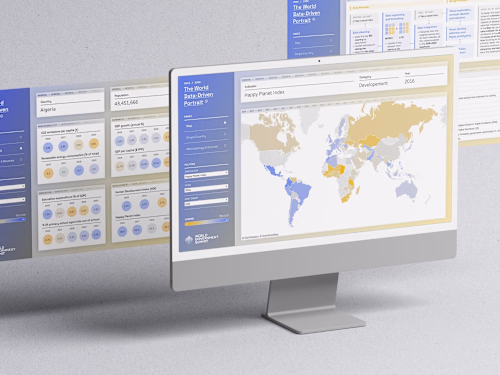
Example work
Alessia's other services

Starting at$1,200
Tags
Figma
Looker
Microsoft Excel
Tableau
Data Analyst
Data Visualizer
UI Designer
Service provided by
Alessia Musio Milan, Italy
- 5
- Followers
Pixel-Perfect DashboardAlessia Musio
Starting at$1,200
Tags
Figma
Looker
Microsoft Excel
Tableau
Data Analyst
Data Visualizer
UI Designer
A dashboarding service is a specialized offering that focuses on creating interactive and informative dashboards to enable clients to visualize, analyze, and interpret complex data in a user-friendly manner. These dashboards serve as consolidated visual interfaces that provide real-time insights and actionable information, facilitating data-driven decision-making
What's included
Project Scope and Requirements Document
A detailed document outlining the project's objectives, target audience, data sources, and specific requirements for the dashboards.
Data Preparation and Integration
Gather, clean, and preprocess the necessary data from various sources to ensure that it is ready for visualization. This might involve data transformation, blending, and joining.
Dashboard Wireframes and Mockups
Create initial wireframes or mockups that outline the layout, arrangement of visualizations, and user interface elements within the dashboards.
Data Visualization Design
Develop a range of data visualizations, such as charts, graphs, maps, and tables, that effectively communicate insights. Choose appropriate visualization types to match the data and objectives.
Dashboard Creation
Build interactive dashboards using Tableau or Looker Studio's tools. Arrange visualizations logically, implement filters, parameters, and other interactive elements for user exploration.
Example work
Alessia's other services
$1,200