
Data VisualisationJames Kamiano

I specialize in creating insightful data visualizations that transform raw data into clear, actionable insights through interactive dashboards and customized reports in Power BI, Tableau, and Excel. My unique approach combines technical expertise with a deep understanding of business needs, ensuring that each visualization not only looks great but also drives informed decisions. What sets me apart is my dedication to delivering tailored solutions and providing training to empower clients to fully utilize and understand their visualized data.
What's included
Dashboards and Data Visualizations
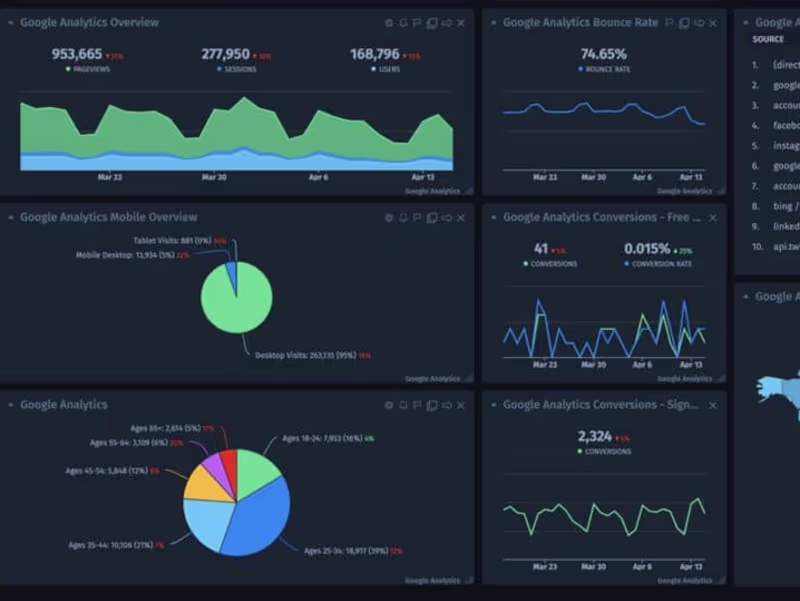
I deliver interactive dashboards in Power BI, Tableau, or Excel, tailored to showcase key trends and insights specific to your business needs. Each visualization is designed to be both intuitive and impactful, helping you quickly grasp complex data. I also provide detailed reports that complement the dashboards, offering a deeper dive into the analysis. Additionally, I offer training sessions to ensure you can fully leverage the visualizations for ongoing decision-making.
James's other services
Contact for pricing
Tags
Matplotlib
Microsoft Excel
Microsoft Power BI
Tableau
Data Analyst
Data Scientist
Data Visualizer
Service provided by
James Kamiano Kenya
Data VisualisationJames Kamiano
Contact for pricing
Tags
Matplotlib
Microsoft Excel
Microsoft Power BI
Tableau
Data Analyst
Data Scientist
Data Visualizer
I specialize in creating insightful data visualizations that transform raw data into clear, actionable insights through interactive dashboards and customized reports in Power BI, Tableau, and Excel. My unique approach combines technical expertise with a deep understanding of business needs, ensuring that each visualization not only looks great but also drives informed decisions. What sets me apart is my dedication to delivering tailored solutions and providing training to empower clients to fully utilize and understand their visualized data.
What's included
Dashboards and Data Visualizations
I deliver interactive dashboards in Power BI, Tableau, or Excel, tailored to showcase key trends and insights specific to your business needs. Each visualization is designed to be both intuitive and impactful, helping you quickly grasp complex data. I also provide detailed reports that complement the dashboards, offering a deeper dive into the analysis. Additionally, I offer training sessions to ensure you can fully leverage the visualizations for ongoing decision-making.
James's other services
Contact for pricing