
Excel Dashboard & Reporting SystemJanine Kruger
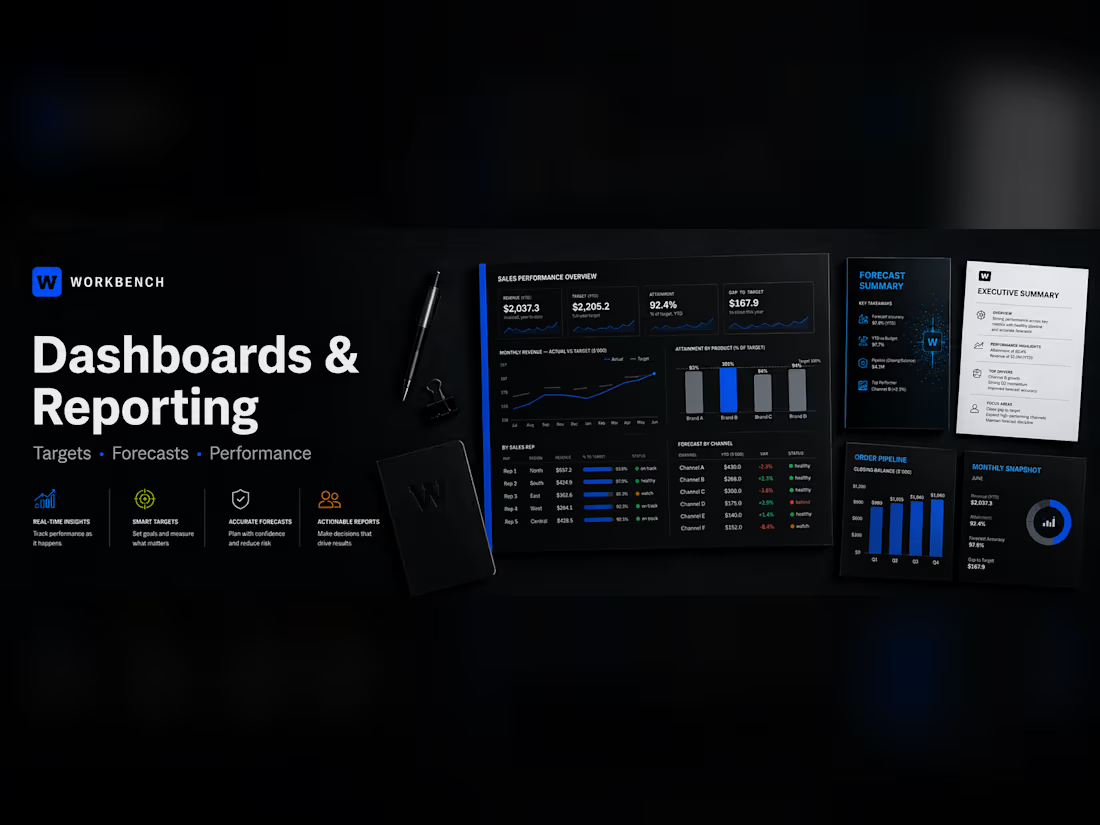
Turn scattered spreadsheets and manual reports into one clear, practical management view.
I design custom Excel dashboards that help teams track performance, compare actual results with targets, review provided forecast data and identify gaps that need attention.
This service includes:
One professionally designed Excel dashboard
Up to four key performance indicators
Up to two charts or reporting views
Actual, target and variance reporting
One structured source-data table
An editable, easy-to-maintain workbook
One revision round
Handover notes explaining how to update the report
This launch package is designed for one focused reporting requirement using a clean, manageable dataset.
Complex data cleaning, multiple data sources, Power Query automation, VBA, custom forecasting models, additional dashboards or ongoing support will be quoted separately.
The four-day turnaround begins once the complete source data, reporting requirements and any brand references have been received.
You receive a clear reporting tool built around the decisions your team needs to make.
Less dazzle. More useful.
FAQs
Example work
Janine's other services


Starting at$150
Duration4 days
Tags
Microsoft Excel

Business Analyst
Business Consultant
Dashboard Development
Data Visualizer
Reporting
Data Reporting
Forecasting
Sales Analytics
Service provided by
Janine Kruger Johannesburg, South Africa
- 1
- Followers
Excel Dashboard & Reporting SystemJanine Kruger
Starting at$150
Duration4 days
Tags
Microsoft Excel
Business Analyst
Business Consultant
Dashboard Development
Data Visualizer
Reporting
Data Reporting
Forecasting
Sales Analytics
Turn scattered spreadsheets and manual reports into one clear, practical management view.
I design custom Excel dashboards that help teams track performance, compare actual results with targets, review provided forecast data and identify gaps that need attention.
This service includes:
One professionally designed Excel dashboard
Up to four key performance indicators
Up to two charts or reporting views
Actual, target and variance reporting
One structured source-data table
An editable, easy-to-maintain workbook
One revision round
Handover notes explaining how to update the report
This launch package is designed for one focused reporting requirement using a clean, manageable dataset.
Complex data cleaning, multiple data sources, Power Query automation, VBA, custom forecasting models, additional dashboards or ongoing support will be quoted separately.
The four-day turnaround begins once the complete source data, reporting requirements and any brand references have been received.
You receive a clear reporting tool built around the decisions your team needs to make.
Less dazzle. More useful.
FAQs
Example work
Janine's other services
$150