
“Visualize Insights: Transforming Data into Clarity” 📊✨Kevin Mochoge
I specialize in transforming complex datasets into compelling visual narratives that make data accessible and engaging for all audiences.
My unique edge lies in the fusion of aesthetic design with analytical precision, ensuring each visualization not only tells a story but also highlights key insights with clarity and impact.
I pride myself on creating interactive and intuitive dashboards that allow users to explore data in a way that is both informative and visually captivating. 📈🎨
What's included
Data Visualization
An informative, clear, easy to understand, customizable visual communicating insights from your data.
Infographics
A detailed picture communicating data insights.
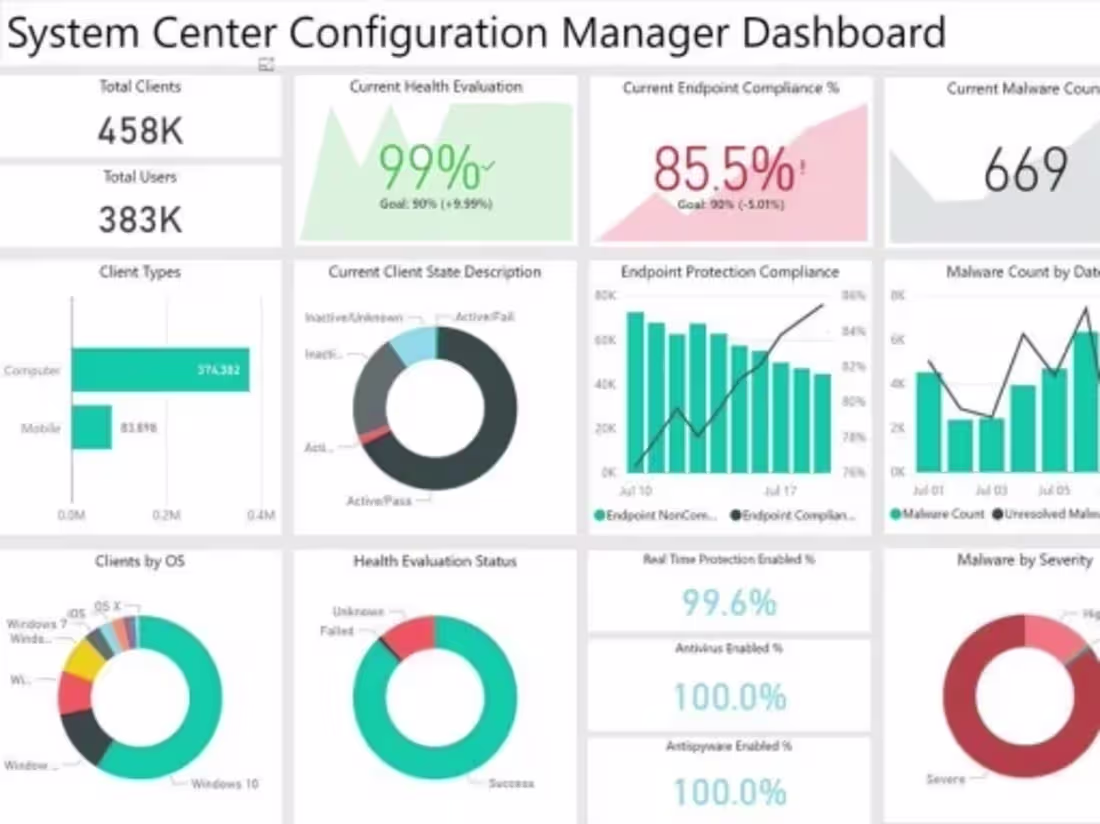
Dashboards
Detailed dashboards easy to understand and tweak to your needs with slices and time series for a range of dates.
Kevin's other services

Starting at$85 /hr
Tags
D3.js
Matplotlib
Tableau
TensorFlow
three.js
Data Analyst
Data Scientist
Data Visualizer
Service provided by
Kevin Mochoge Nairobi, Kenya
“Visualize Insights: Transforming Data into Clarity” 📊✨Kevin Mochoge
Starting at$85 /hr
Tags
D3.js
Matplotlib
Tableau
TensorFlow
three.js
Data Analyst
Data Scientist
Data Visualizer
I specialize in transforming complex datasets into compelling visual narratives that make data accessible and engaging for all audiences.
My unique edge lies in the fusion of aesthetic design with analytical precision, ensuring each visualization not only tells a story but also highlights key insights with clarity and impact.
I pride myself on creating interactive and intuitive dashboards that allow users to explore data in a way that is both informative and visually captivating. 📈🎨
What's included
Data Visualization
An informative, clear, easy to understand, customizable visual communicating insights from your data.
Infographics
A detailed picture communicating data insights.
Dashboards
Detailed dashboards easy to understand and tweak to your needs with slices and time series for a range of dates.
Kevin's other services
$85 /hr