
Knowledge Graph of Business Data for RAG & CAGTayyab Ali
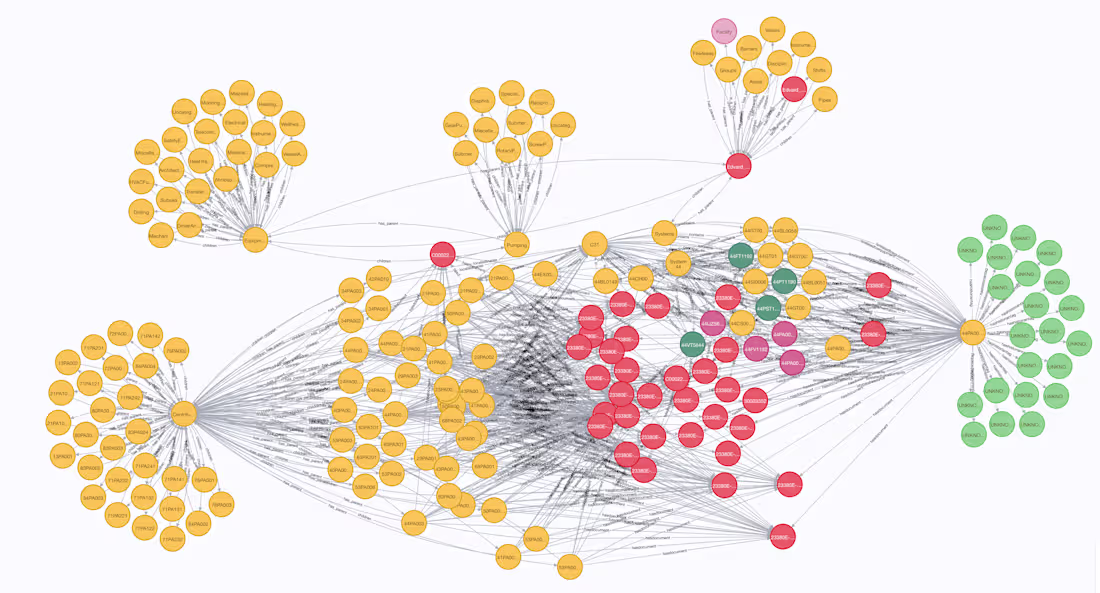
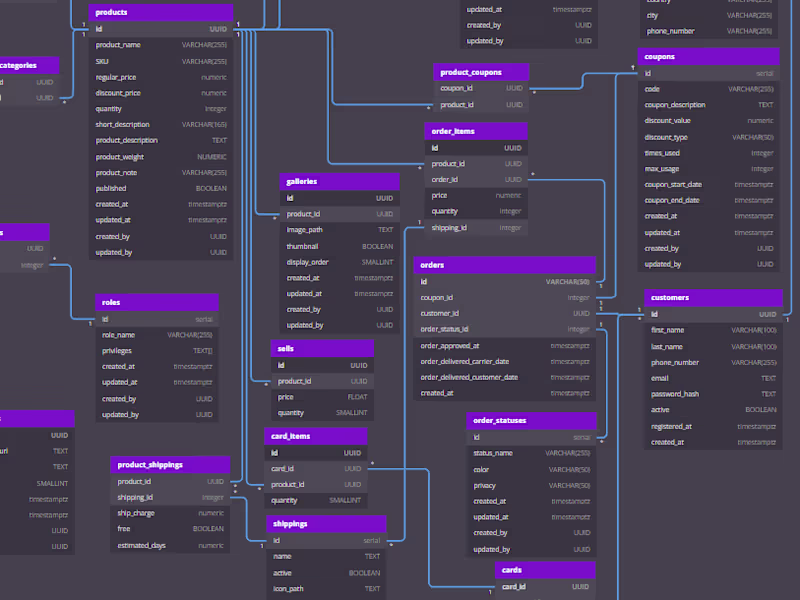
Get a knowledge graph of business data connects disparate pieces of information (customers, products, transactions, campaigns) into a unified network of relationships, not just isolated tables.
Key benefits:
1- Unified view across silos: Links CRM, ERP, marketing, and support data without manual joins.
2- Smarter insights: Reveals hidden patterns (i.e “customers who buy X often ask about Y”).
3-Faster, contextual answers: Enables natural language queries like “Show top products purchased by high-value customers last month.”
4 Real-time decision making: Dashboards and alerts can traverse relationships instantly.
5- Better personalization: Recommends next-best actions based on connected behavior chains.
6 Reduced data prep: Analysts spend less time joining tables and more time analyzing.
For an analytics dashboard, a knowledge graph would help answer cross-channel questions (i.e “Which ad campaigns drive the most repeat purchases among enterprise clients?”)
Starting at$1,000
Duration1 week
Tags
Neo4j
AI Agent Engineer
AI Agent Orchestrator
Calude
RAG
Service provided by
Tayyab Ali Pakistan
- $25k+
- Earned
- 1
- Paid projects
- 5.00
- Rating
- 60
- Followers
Knowledge Graph of Business Data for RAG & CAGTayyab Ali
Starting at$1,000
Duration1 week
Tags
Neo4j
AI Agent Engineer
AI Agent Orchestrator
Calude
RAG
Get a knowledge graph of business data connects disparate pieces of information (customers, products, transactions, campaigns) into a unified network of relationships, not just isolated tables.
Key benefits:
1- Unified view across silos: Links CRM, ERP, marketing, and support data without manual joins.
2- Smarter insights: Reveals hidden patterns (i.e “customers who buy X often ask about Y”).
3-Faster, contextual answers: Enables natural language queries like “Show top products purchased by high-value customers last month.”
4 Real-time decision making: Dashboards and alerts can traverse relationships instantly.
5- Better personalization: Recommends next-best actions based on connected behavior chains.
6 Reduced data prep: Analysts spend less time joining tables and more time analyzing.
For an analytics dashboard, a knowledge graph would help answer cross-channel questions (i.e “Which ad campaigns drive the most repeat purchases among enterprise clients?”)
$1,000