
I will Create Interactive Excel, Power BI and Tableau DashboardEdmond Nathan
Welcome to my Gig!
Hello!
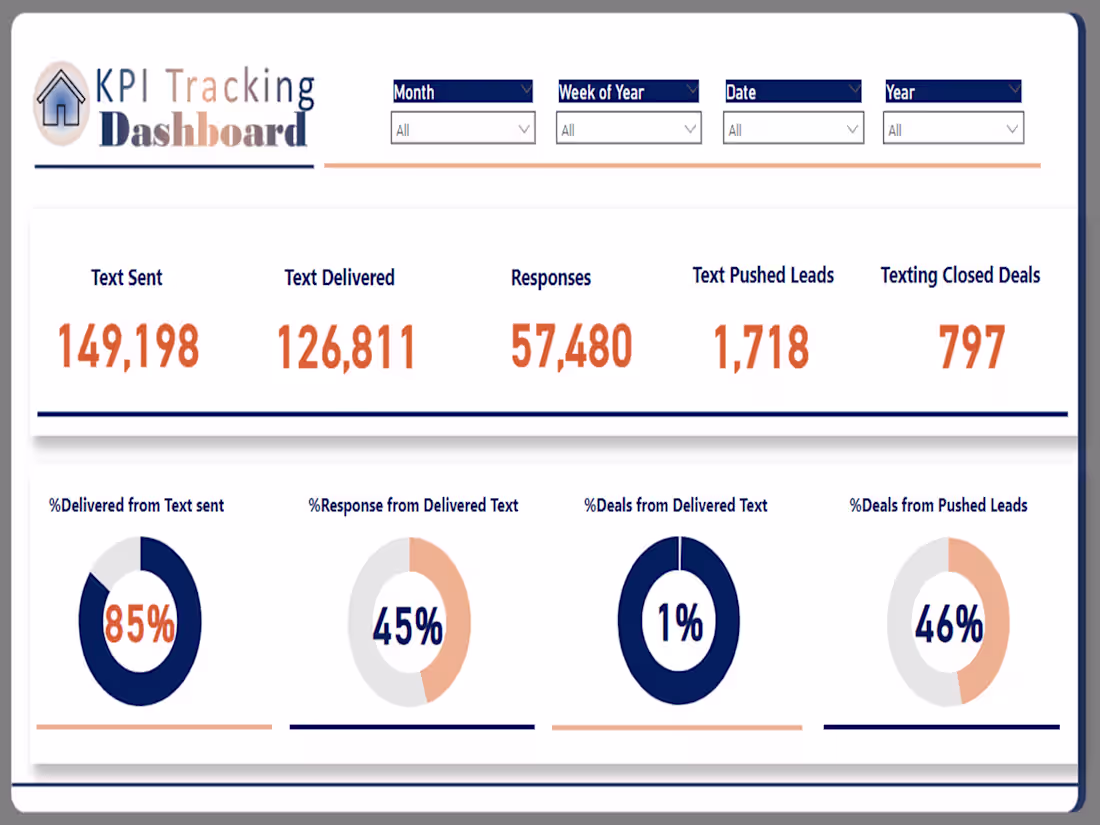
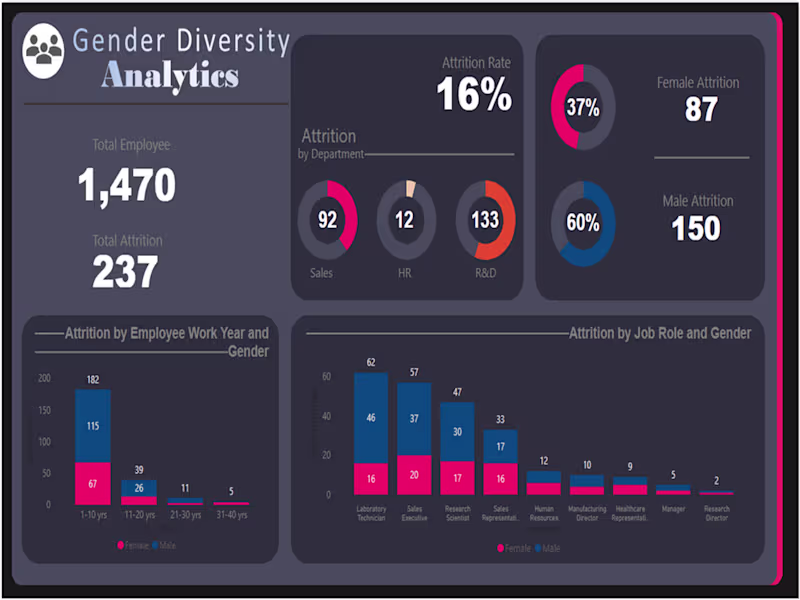
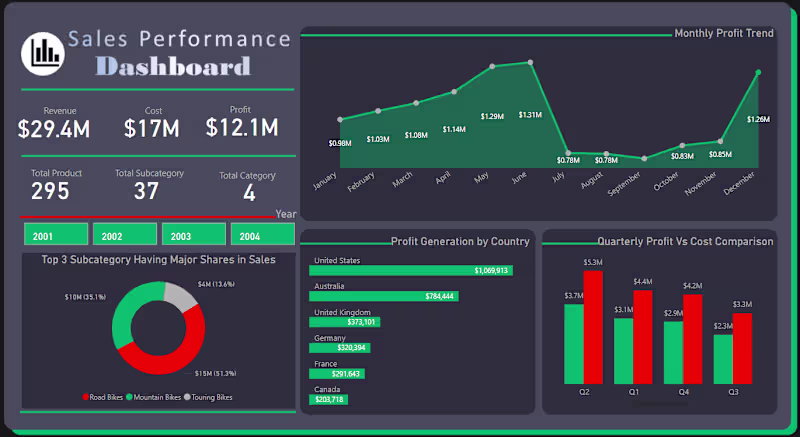
Are you looking to turn your data into actionable insights? Do you need assistance creating visually appealing dynamic custom Excel dashboards, data analysis, or data visualization using Excel, Power BI, or R programming? Look no further
I am a certified Microsoft Power BI Data Analyst with over 3 years of experience. I specialize in data analytics, KPIs creation, and reporting. Whether your data is in Excel, CSV, databases, or SharePoint, I am here to help you make sense of it and drive your business forward.
My Services
Data Source Connectivity (Excel, CSV, SharePoint, database)
Data Cleaning, and Transformation
Data modeling or joining
Excel Data Analysis using basic and advanced functions
Excel Reporting with Pivot tables, Graphs and Charts
Using Power BI DAX to calculate metrics and KPIs that define your business
Data Analysis to find Key metrics, trends and patterns
Data Visualization to tell the story of your data
Interactive and automated dashboard and reports design in Excel and PowerBI
R programming data analysis
Data Visualization with Tableau
Tools I can use:
Excel
Power BI
R
Tableau
Contact me now, let's discuss your requirements
What's included
Baseline
You will get an initial look of your project
Starting at$30
Duration3 days
Tags
ggplot2
Matplotlib
Microsoft Excel
Microsoft Power BI
Tableau
Data Analyst
Data Scientist
Data Visualizer
Service provided by
Edmond Nathan Lagos, Nigeria
- 5.00
- Rating
I will Create Interactive Excel, Power BI and Tableau DashboardEdmond Nathan
Starting at$30
Duration3 days
Tags
ggplot2
Matplotlib
Microsoft Excel
Microsoft Power BI
Tableau
Data Analyst
Data Scientist
Data Visualizer
Welcome to my Gig!
Hello!
Are you looking to turn your data into actionable insights? Do you need assistance creating visually appealing dynamic custom Excel dashboards, data analysis, or data visualization using Excel, Power BI, or R programming? Look no further
I am a certified Microsoft Power BI Data Analyst with over 3 years of experience. I specialize in data analytics, KPIs creation, and reporting. Whether your data is in Excel, CSV, databases, or SharePoint, I am here to help you make sense of it and drive your business forward.
My Services
Data Source Connectivity (Excel, CSV, SharePoint, database)
Data Cleaning, and Transformation
Data modeling or joining
Excel Data Analysis using basic and advanced functions
Excel Reporting with Pivot tables, Graphs and Charts
Using Power BI DAX to calculate metrics and KPIs that define your business
Data Analysis to find Key metrics, trends and patterns
Data Visualization to tell the story of your data
Interactive and automated dashboard and reports design in Excel and PowerBI
R programming data analysis
Data Visualization with Tableau
Tools I can use:
Excel
Power BI
R
Tableau
Contact me now, let's discuss your requirements
What's included
Baseline
You will get an initial look of your project
$30