
Transform Your Data into Engaging Visual InsightsSukritha
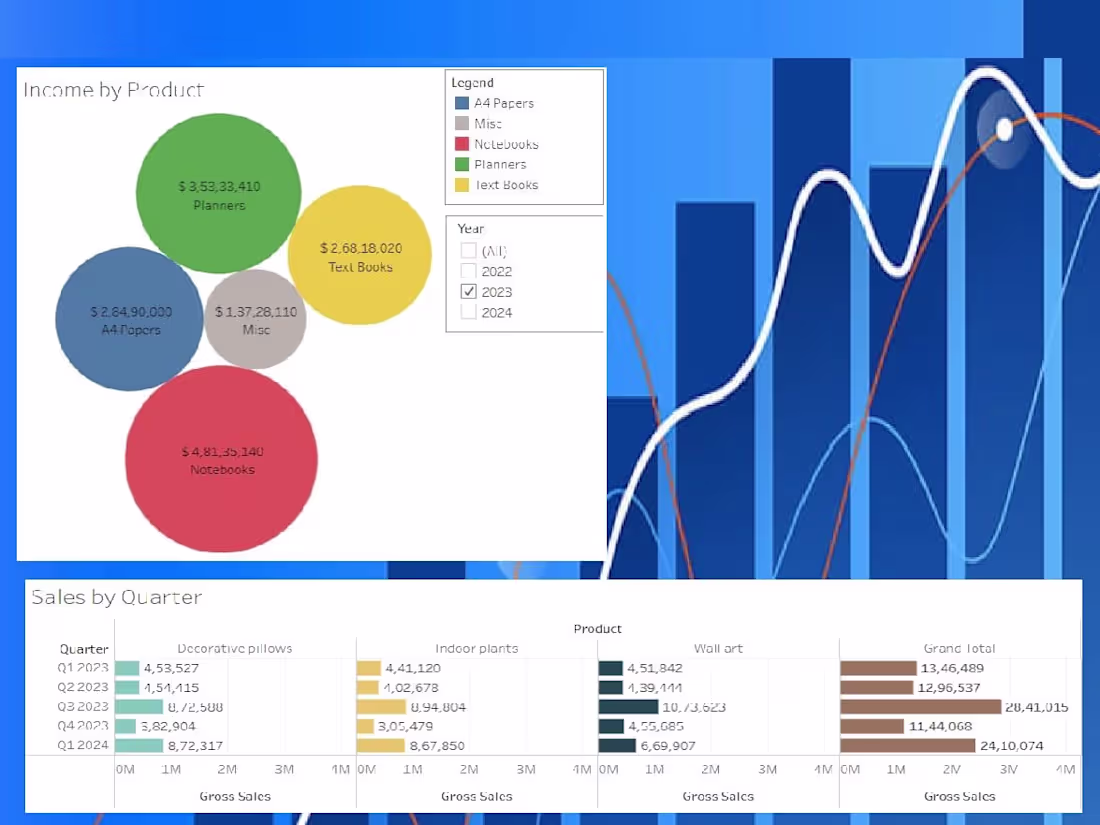
I offer custom data visualization services that transform complex data into clear, actionable insights using tools like Tableau, PowerBI, and Excel. My focus is on creating interactive dashboards and visual reports that make data easy to understand, enabling informed decision-making.
What's included
Customized Dashboards
Custom-built dashboards tailored to client-specific needs. - Accessible through platforms like Tableau, Power BI, or Google Data Studio.
Data Analysis Report
High-quality, visually appealing charts, graphs, and infographics. - Visualizations optimized for clarity and impact and summary of key trends, insights, and recommendations based on visualizations.
Source Files
Original files in Tableau, PowerBI, or Excel formats (as per needs).
Documentation
A guide to help you understand and navigate the visualizations.
Sukritha's other services
Starting at$15 /hr
Tags
Microsoft Excel
Microsoft Power BI
Python
SQL
Tableau
Data Analyst
Data Visualizer
Service provided by
Sukritha India
Transform Your Data into Engaging Visual InsightsSukritha
Starting at$15 /hr
Tags
Microsoft Excel
Microsoft Power BI
Python
SQL
Tableau
Data Analyst
Data Visualizer
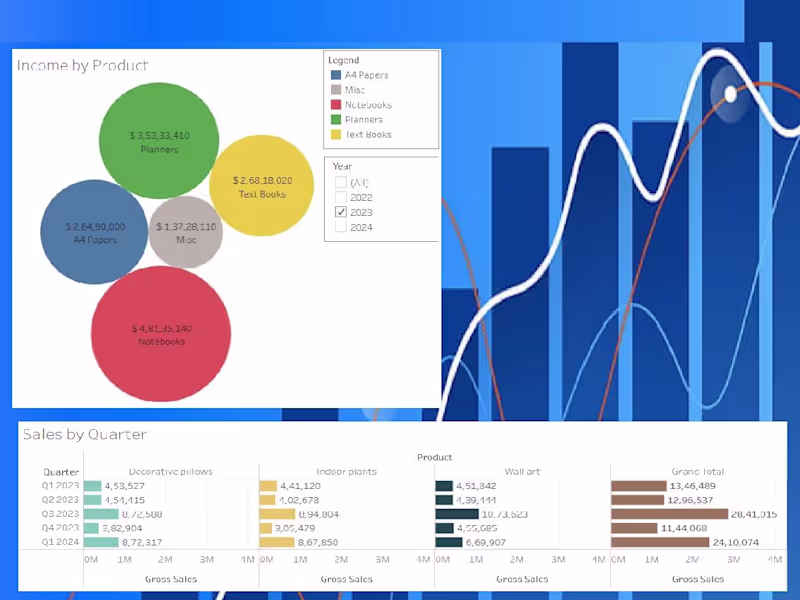
I offer custom data visualization services that transform complex data into clear, actionable insights using tools like Tableau, PowerBI, and Excel. My focus is on creating interactive dashboards and visual reports that make data easy to understand, enabling informed decision-making.
What's included
Customized Dashboards
Custom-built dashboards tailored to client-specific needs. - Accessible through platforms like Tableau, Power BI, or Google Data Studio.
Data Analysis Report
High-quality, visually appealing charts, graphs, and infographics. - Visualizations optimized for clarity and impact and summary of key trends, insights, and recommendations based on visualizations.
Source Files
Original files in Tableau, PowerBI, or Excel formats (as per needs).
Documentation
A guide to help you understand and navigate the visualizations.
Sukritha's other services
$15 /hr