
Dashboard and Data Visualization SolutionsMuhammad Arsalan Amjad

I design custom interactive dashboards that allow businesses to monitor key performance indicators and make data-driven decisions in real-time. My use of state-of-the-art visualization tools like Dash and Plotly sets me apart by enhancing the interactivity and aesthetic appeal of data presentations.
What's included
Custom Dashboard
A tailored interactive dashboard that facilitates real-time data monitoring and analysis.
User Manual
A manual explaining how to navigate, interpret, and manage the dashboard.
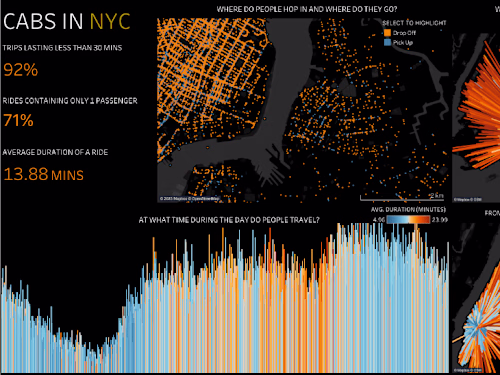
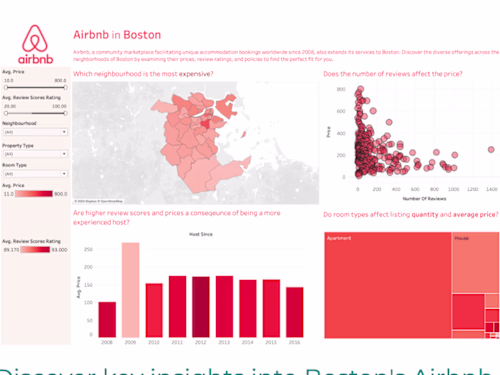
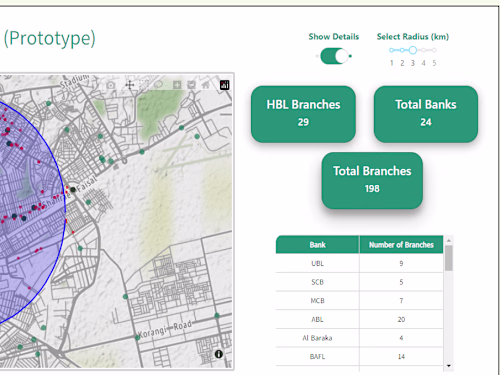
Example work
Muhammad Arsalan's other services


Contact for pricing
Tags
Matplotlib
Microsoft Power BI
Python
SQL
Tableau
Data Analyst
Data Scientist
Data Visualizer
Service provided by
Muhammad Arsalan Amjad Karachi, Pakistan
- 1
- Followers
Dashboard and Data Visualization SolutionsMuhammad Arsalan Amjad
Contact for pricing
Tags
Matplotlib
Microsoft Power BI
Python
SQL
Tableau
Data Analyst
Data Scientist
Data Visualizer
I design custom interactive dashboards that allow businesses to monitor key performance indicators and make data-driven decisions in real-time. My use of state-of-the-art visualization tools like Dash and Plotly sets me apart by enhancing the interactivity and aesthetic appeal of data presentations.
What's included
Custom Dashboard
A tailored interactive dashboard that facilitates real-time data monitoring and analysis.
User Manual
A manual explaining how to navigate, interpret, and manage the dashboard.
Example work
Muhammad Arsalan's other services
Contact for pricing