
Interactive Data Visualization DashboardBarra Malik Wibowo
We offer a comprehensive data visualization service, beginning with a thorough understanding of client needs, data cleaning, and the creation of an interactive dashboard using the client's chosen tool.
What sets us apart is our commitment to transparency, providing detailed reports at each stage, coupled with three rounds of revisions based on client feedback, ensuring a tailored and refined solution that precisely meets your unique data visualization requirements.
What's included
Client Requirement Analysis
Thorough consultation to grasp your specific data visualization needs. Followed by a detailed report summarizing the same, ensuring a clear understanding of project objectives and expectations.
Data Cleaning Report
A concise report outlining the steps taken to clean and pre-process the extracted data, addressing any inconsistencies or outliers.
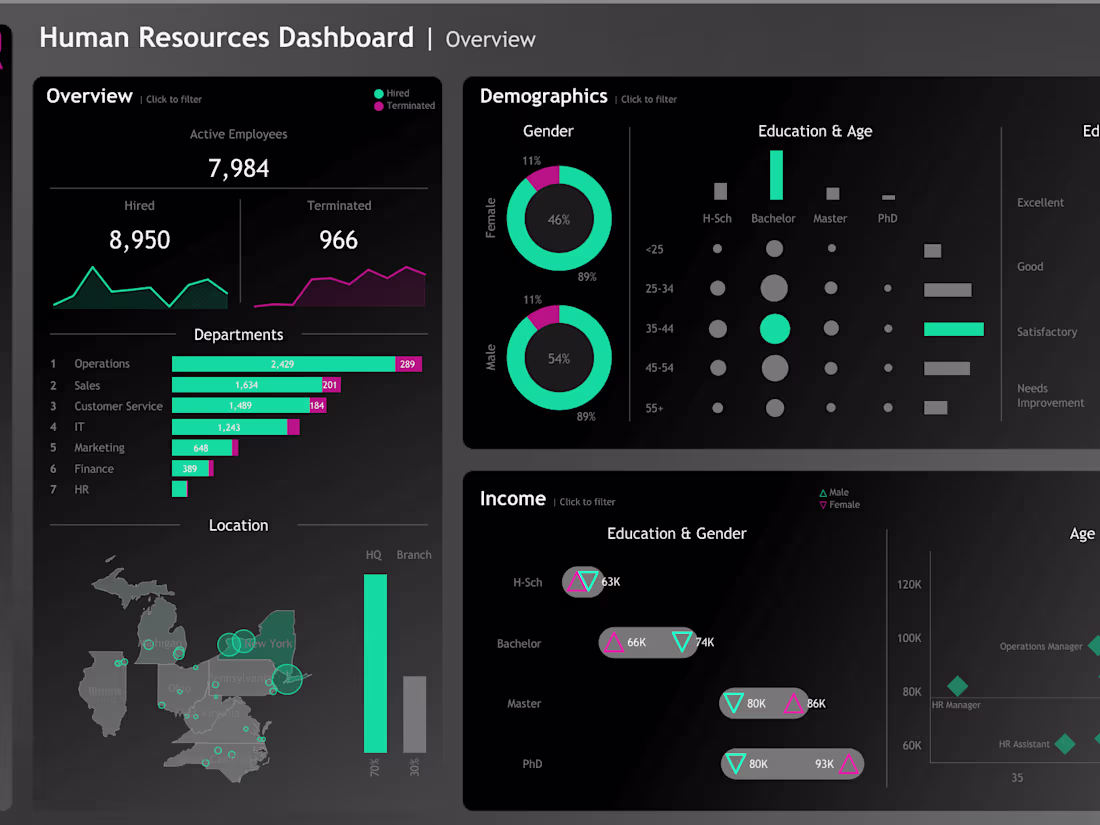
Interactive Data Visualization Dashboard
Creation of an engaging and interactive dashboard using the client-specified tool and thereby delivering a powerful visual representation of the cleaned data.
Revision Based on Client Feedback
Three rounds of revisions to the interactive data visualization dashboard based on client feedback, ensuring the final product aligns seamlessly with your expectations and requirements.
Barra Malik Wibowo's other services
Starting at$60
Duration1 week
Tags
Google Sheets
Looker Studio
Microsoft Excel
Microsoft Power BI
Tableau
Data Analyst
Data Visualizer
Data Scraper
Service provided by
Barra Malik Wibowo South Jakarta, Indonesia
- 1
- Followers
Interactive Data Visualization DashboardBarra Malik Wibowo
Starting at$60
Duration1 week
Tags
Google Sheets
Looker Studio
Microsoft Excel
Microsoft Power BI
Tableau
Data Analyst
Data Visualizer
Data Scraper
We offer a comprehensive data visualization service, beginning with a thorough understanding of client needs, data cleaning, and the creation of an interactive dashboard using the client's chosen tool.
What sets us apart is our commitment to transparency, providing detailed reports at each stage, coupled with three rounds of revisions based on client feedback, ensuring a tailored and refined solution that precisely meets your unique data visualization requirements.
What's included
Client Requirement Analysis
Thorough consultation to grasp your specific data visualization needs. Followed by a detailed report summarizing the same, ensuring a clear understanding of project objectives and expectations.
Data Cleaning Report
A concise report outlining the steps taken to clean and pre-process the extracted data, addressing any inconsistencies or outliers.
Interactive Data Visualization Dashboard
Creation of an engaging and interactive dashboard using the client-specified tool and thereby delivering a powerful visual representation of the cleaned data.
Revision Based on Client Feedback
Three rounds of revisions to the interactive data visualization dashboard based on client feedback, ensuring the final product aligns seamlessly with your expectations and requirements.
Barra Malik Wibowo's other services
$60