
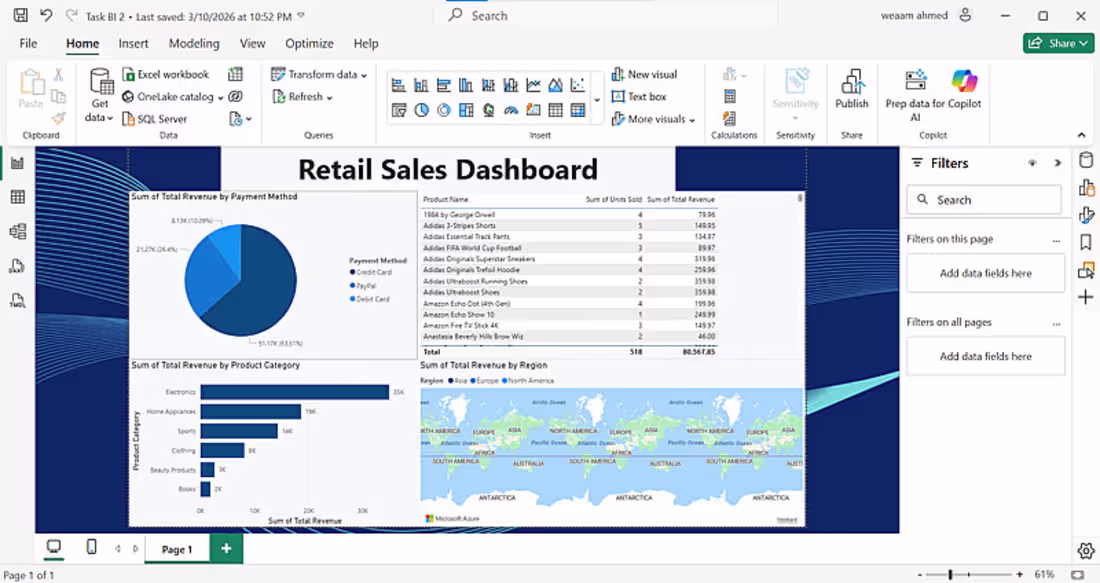
Creating interactive dashboards using Microsoft Power BI.Weam Ahmed
Do you want a clearer view of your data instead of dealing with complex and scattered numbers?
I offer professional Dashboard Design services that help you monitor business performance and make faster, data-driven decisions. Your raw data will be transformed into an interactive dashboard that presents key insights in a simple, clear, and visually engaging way.
What’s Included:
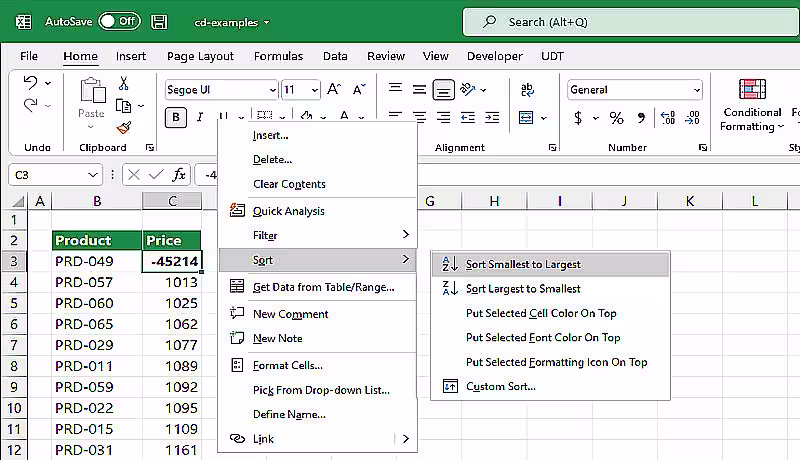
Data analysis and KPI identification
Interactive dashboard design using Excel or Microsoft Power BI
Interactive charts and visualizations
User-friendly filters and navigation
Clean and professional layout for better data understanding
Each dashboard is customized to fit your business needs, whether for sales, marketing, finance, e-commerce, or other industries, with a strong focus on usability and future scalability.
This service is ideal for business owners, companies, e-commerce stores, and analysts who need continuous and clear performance tracking.
The goal is to transform your data into a smart dashboard that provides actionable insights and supports confident decision-making.
Basic Package Includes:
One dashboard page
Dataset up to 1,000 rows
Up to 5 columns
Weam's other services
Contact for pricing
Duration1 week
Tags
Data Analyst
Data Visualizer
Dashboard Design
Power Bi
Service provided by
Weam Ahmed Cairo, Egypt
Creating interactive dashboards using Microsoft Power BI.Weam Ahmed
Contact for pricing
Duration1 week
Tags
Data Analyst
Data Visualizer
Dashboard Design
Power Bi
Do you want a clearer view of your data instead of dealing with complex and scattered numbers?
I offer professional Dashboard Design services that help you monitor business performance and make faster, data-driven decisions. Your raw data will be transformed into an interactive dashboard that presents key insights in a simple, clear, and visually engaging way.
What’s Included:
Data analysis and KPI identification
Interactive dashboard design using Excel or Microsoft Power BI
Interactive charts and visualizations
User-friendly filters and navigation
Clean and professional layout for better data understanding
Each dashboard is customized to fit your business needs, whether for sales, marketing, finance, e-commerce, or other industries, with a strong focus on usability and future scalability.
This service is ideal for business owners, companies, e-commerce stores, and analysts who need continuous and clear performance tracking.
The goal is to transform your data into a smart dashboard that provides actionable insights and supports confident decision-making.
Basic Package Includes:
One dashboard page
Dataset up to 1,000 rows
Up to 5 columns
Weam's other services
Contact for pricing