
Data Visualization ConsultingHakiki Sandhika Raja
Hakiki transformed complex datasets into clear, insightful visual representations for informed decision-making.
What's included
Infographic, Data Dashboard, and Interactive Infographic
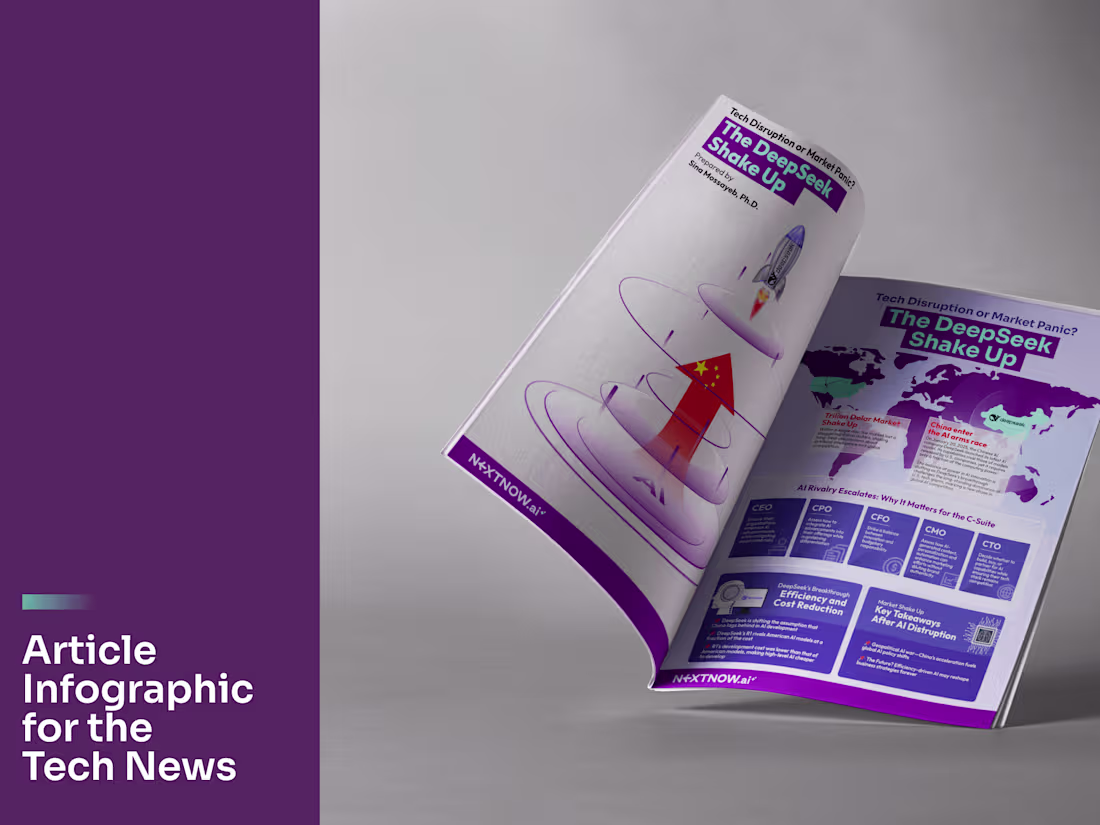
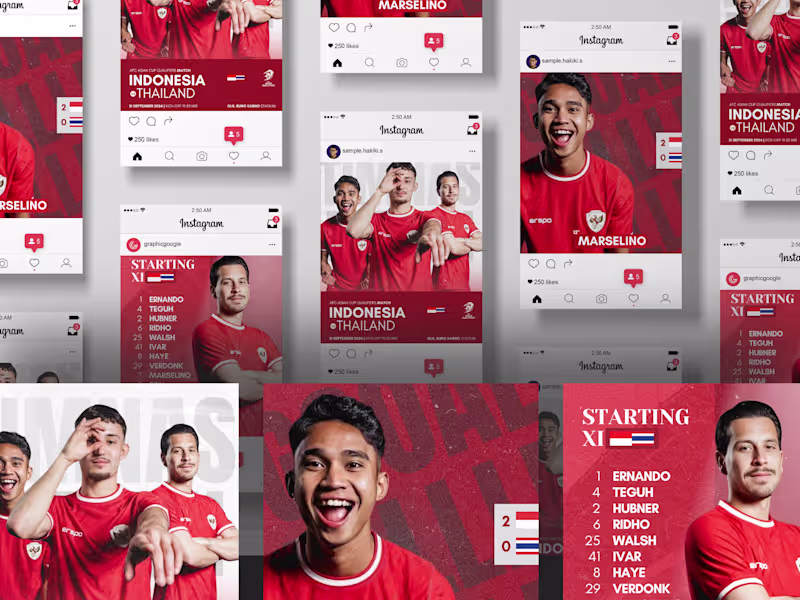
Infographic – A high-quality static digital file (PNG, JPEG, or PDF) featuring a well-designed visual representation of data or information. Perfect for presentations, reports, and social media sharing.
Data Dashboard – A professionally designed, clean, and intuitive dashboard that organizes and visualizes key metrics in a clear format. Delivered in platforms like Tableau, Power BI, or Google Data Studio, depending on client needs.
Interactive Infographic – A dynamic infographic with interactive elements, allowing users to engage with the content through clickable features, hover effects, or animations. Ideal for websites, reports, or digital publications.
Hakiki's other services
Contact for pricing
Tags
Tableau
Data Analyst
Data Scientist
Data Visualizer
Service provided by
Hakiki Sandhika Raja Palangkaraya, Indonesia
Data Visualization ConsultingHakiki Sandhika Raja
Contact for pricing
Tags
Tableau
Data Analyst
Data Scientist
Data Visualizer
Hakiki transformed complex datasets into clear, insightful visual representations for informed decision-making.
What's included
Infographic, Data Dashboard, and Interactive Infographic
Infographic – A high-quality static digital file (PNG, JPEG, or PDF) featuring a well-designed visual representation of data or information. Perfect for presentations, reports, and social media sharing.
Data Dashboard – A professionally designed, clean, and intuitive dashboard that organizes and visualizes key metrics in a clear format. Delivered in platforms like Tableau, Power BI, or Google Data Studio, depending on client needs.
Interactive Infographic – A dynamic infographic with interactive elements, allowing users to engage with the content through clickable features, hover effects, or animations. Ideal for websites, reports, or digital publications.
Hakiki's other services
Contact for pricing