
Custom Data Visualization Solutions (Looker Studio/Tableau)Benjamin van der Merwe
📊 Looking to transform your data into stunning visuals? Look no further! 📈 I craft bespoke Tableau and Looker Studio reports that bring your insights to life. ✨
🔍 With my expertise, I'll turn complex datasets into interactive dashboards and eye-catching charts, tailored to your specific needs. 🎨
🤝 Your satisfaction is my priority! I'm committed to delivering visually appealing and informative data solutions that empower your decision-making. 💪 Let's unlock the full potential of your data together! 🚀
What's included
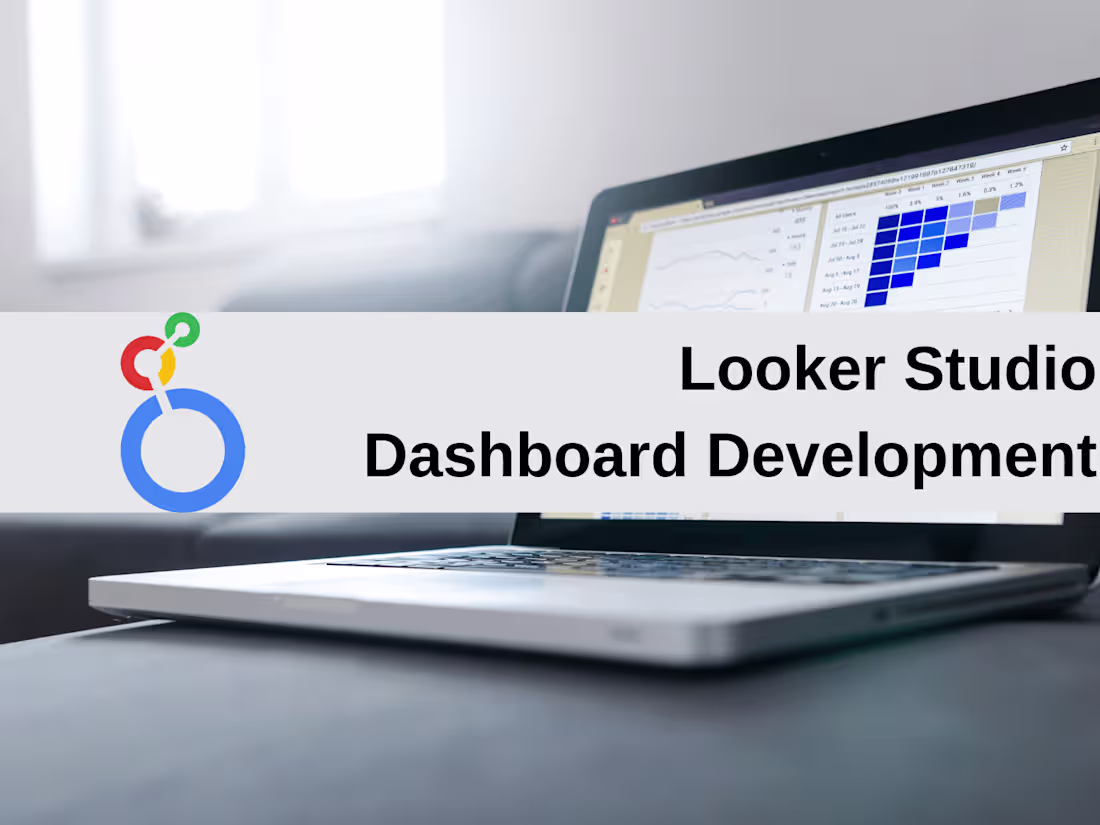
Interactive Dashboards
📊 Custom-made interactive dashboards 🔧 just for you! 👀 Easily explore and analyze your data 📈 with a user-friendly interface. 🖱️
Visualizations
📊 Bar charts, 📈 line graphs, 📊 scatter plots, 🔥 heatmaps, 📊 histograms, 🥧 pie charts, and more! 👀 Your data transformed into eye-catching visuals that tell a story. 🎨 Each chart carefully crafted to highlight key insights and trends. 🌟
Dashboard Documentation
📊🗂️ A guide to the dashboards we made! 🗺️🔍 It tells you what each chart means, how to use the filters 🎚️, and how to navigate the dashboard. 🕹️
Tableau Workbook (if applicable)
The Tableau workbook 📊 (.twbx or .twb file) 🗂️ holds all the cool charts and dashboards we created! ✨ This means you can open it up 🔓 and play around with the data using Tableau Desktop 🖥️ or Tableau Reader. 🤓
Editor Access to the Looker Studio Report (if applicable)
You're the captain of this ship! 🚢 Feel free to add ➕, remove ➖, or shuffle the pages as you please. It's all under your control! 🎛️
Data Source Integration
All Default Data Sources, are included in the setup of the Looker Report. All other Data Sources will be at the cost of the client.
FAQs
Starting at$100
Duration1 week
Tags
Looker
Tableau
Business Analyst
Data Analyst
Data Visualizer
Service provided by
Benjamin van der Merwe Sandton, South Africa
- 9
- Followers
Custom Data Visualization Solutions (Looker Studio/Tableau)Benjamin van der Merwe
Starting at$100
Duration1 week
Tags
Looker
Tableau
Business Analyst
Data Analyst
Data Visualizer
📊 Looking to transform your data into stunning visuals? Look no further! 📈 I craft bespoke Tableau and Looker Studio reports that bring your insights to life. ✨
🔍 With my expertise, I'll turn complex datasets into interactive dashboards and eye-catching charts, tailored to your specific needs. 🎨
🤝 Your satisfaction is my priority! I'm committed to delivering visually appealing and informative data solutions that empower your decision-making. 💪 Let's unlock the full potential of your data together! 🚀
What's included
Interactive Dashboards
📊 Custom-made interactive dashboards 🔧 just for you! 👀 Easily explore and analyze your data 📈 with a user-friendly interface. 🖱️
Visualizations
📊 Bar charts, 📈 line graphs, 📊 scatter plots, 🔥 heatmaps, 📊 histograms, 🥧 pie charts, and more! 👀 Your data transformed into eye-catching visuals that tell a story. 🎨 Each chart carefully crafted to highlight key insights and trends. 🌟
Dashboard Documentation
📊🗂️ A guide to the dashboards we made! 🗺️🔍 It tells you what each chart means, how to use the filters 🎚️, and how to navigate the dashboard. 🕹️
Tableau Workbook (if applicable)
The Tableau workbook 📊 (.twbx or .twb file) 🗂️ holds all the cool charts and dashboards we created! ✨ This means you can open it up 🔓 and play around with the data using Tableau Desktop 🖥️ or Tableau Reader. 🤓
Editor Access to the Looker Studio Report (if applicable)
You're the captain of this ship! 🚢 Feel free to add ➕, remove ➖, or shuffle the pages as you please. It's all under your control! 🎛️
Data Source Integration
All Default Data Sources, are included in the setup of the Looker Report. All other Data Sources will be at the cost of the client.
FAQs
$100