
Strategic Data Visualization: Bringing Your Data to LifeKailyn Barrera
I offer expert data visualization services that transform complex data into clear, compelling, and actionable insights. With a blend of analytical expertise and design skills, I create custom visualizations that not only accurately represent your data but also tell a powerful story. My unique approach combines cutting-edge visualization techniques with a deep understanding of business needs, ensuring that your data drives decision-making and communicates effectively to all stakeholders (technical and nontechnical).
What's included
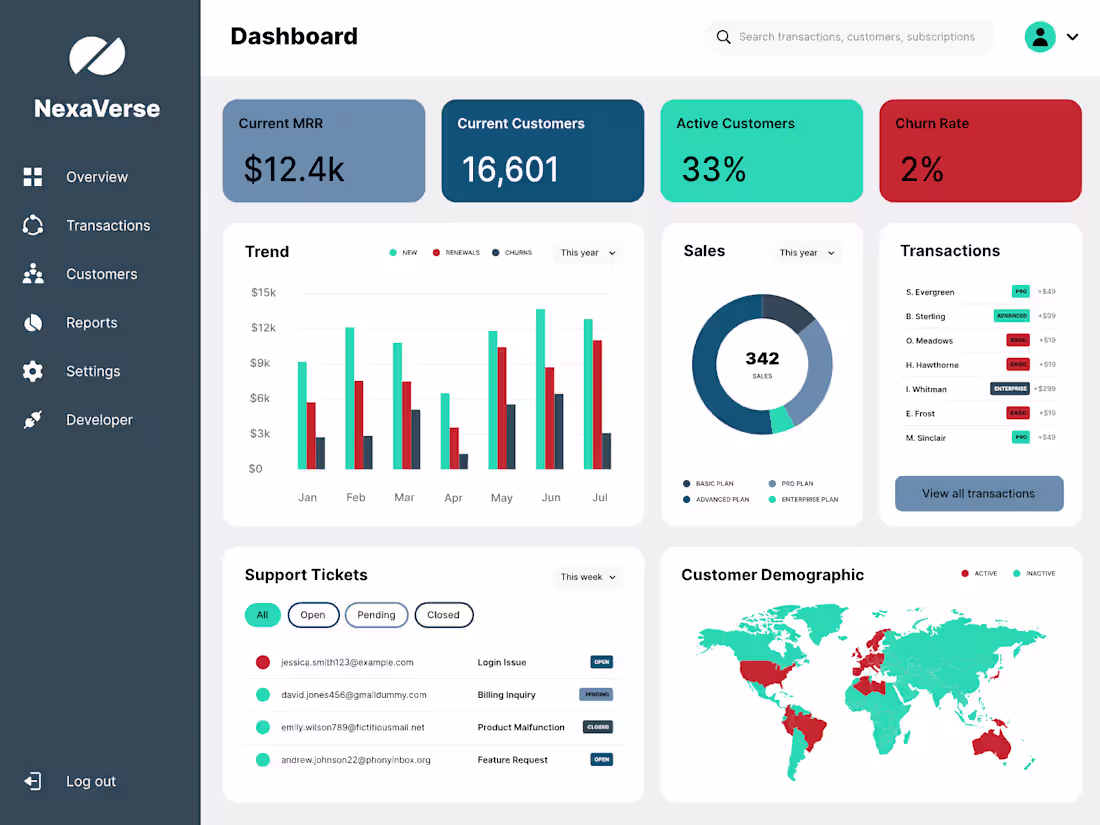
Interactive Data Dashboard
Rated best dashboard by CEO and 2 COO's. A custom-built, interactive dashboard that visualizes key metrics and trends from your data. This user-friendly interface allows for easy exploration and analysis of your data, with features like filters, drill-downs, and hover-over information.
Comprehensive Data Visualization Report
A detailed report containing a variety of data visualizations (charts, graphs, infographics) that tell the story of your data. This report includes written analysis and insights derived from the visualizations.
Data Visualization Style Guide
A comprehensive guide outlining the visual style, color schemes, and best practices for future data visualizations within your organization, ensuring consistency and clarity in all data communications.
Contact for pricing
Tags
Amplitude
Google Analytics
Mode Analytics
Snowflake
Tableau
Data Analyst
Data Scientist
Data Visualizer
Service provided by
Kailyn Barrera New York, USA
Strategic Data Visualization: Bringing Your Data to LifeKailyn Barrera
Contact for pricing
Tags
Amplitude
Google Analytics
Mode Analytics
Snowflake
Tableau
Data Analyst
Data Scientist
Data Visualizer
I offer expert data visualization services that transform complex data into clear, compelling, and actionable insights. With a blend of analytical expertise and design skills, I create custom visualizations that not only accurately represent your data but also tell a powerful story. My unique approach combines cutting-edge visualization techniques with a deep understanding of business needs, ensuring that your data drives decision-making and communicates effectively to all stakeholders (technical and nontechnical).
What's included
Interactive Data Dashboard
Rated best dashboard by CEO and 2 COO's. A custom-built, interactive dashboard that visualizes key metrics and trends from your data. This user-friendly interface allows for easy exploration and analysis of your data, with features like filters, drill-downs, and hover-over information.
Comprehensive Data Visualization Report
A detailed report containing a variety of data visualizations (charts, graphs, infographics) that tell the story of your data. This report includes written analysis and insights derived from the visualizations.
Data Visualization Style Guide
A comprehensive guide outlining the visual style, color schemes, and best practices for future data visualizations within your organization, ensuring consistency and clarity in all data communications.
Contact for pricing