
Interactive Dashboards & Custom BI Web AppsMahdi Bettahar
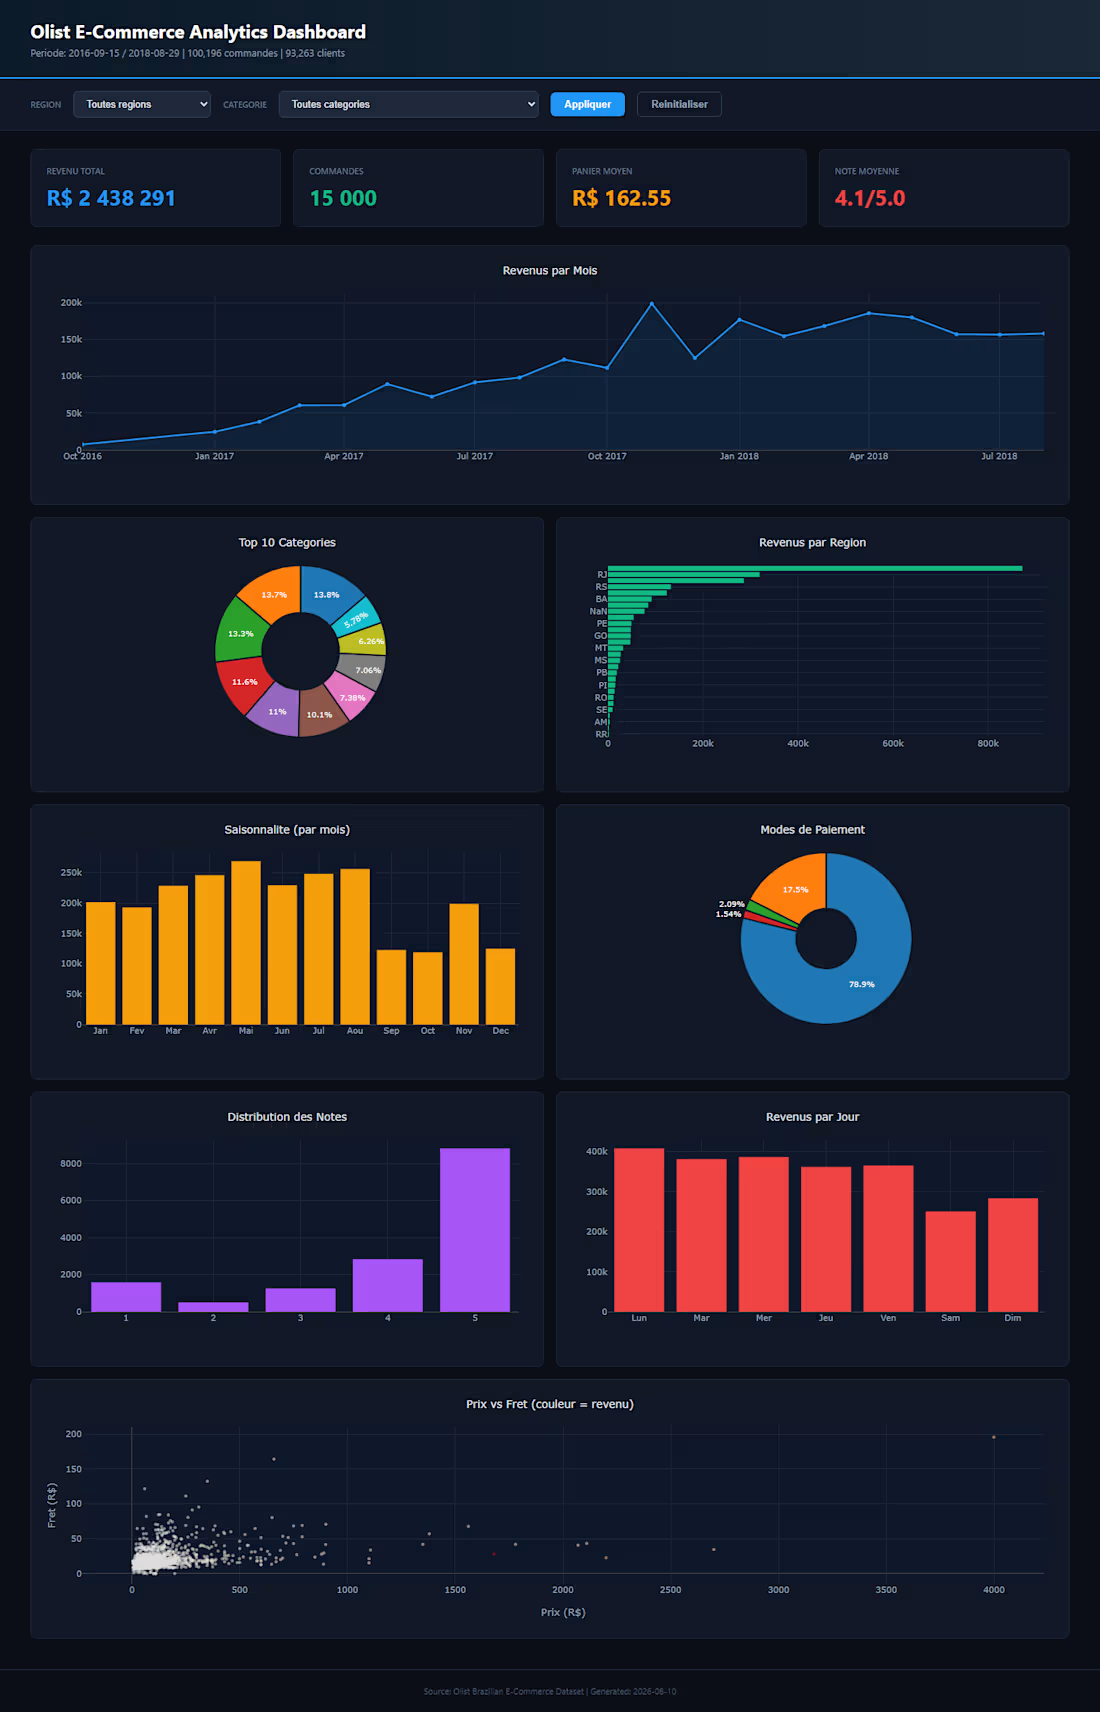
Transform static data into modern, responsive, and fully interactive web dashboards that empower your team to explore metrics on demand.
I build custom analytics web applications using Python, Plotly, and Streamlit or Dash. Instead of looking at flat spreadsheets or static PDF slides, your team gets intuitive dropdowns, date pickers, category filters, and clickable charts that update instantly in real time.
What you get with this service:
Dynamic Filtering & Controls: Filter by date ranges, sales regions, marketing channels, or user tiers with zero page-reload lag.
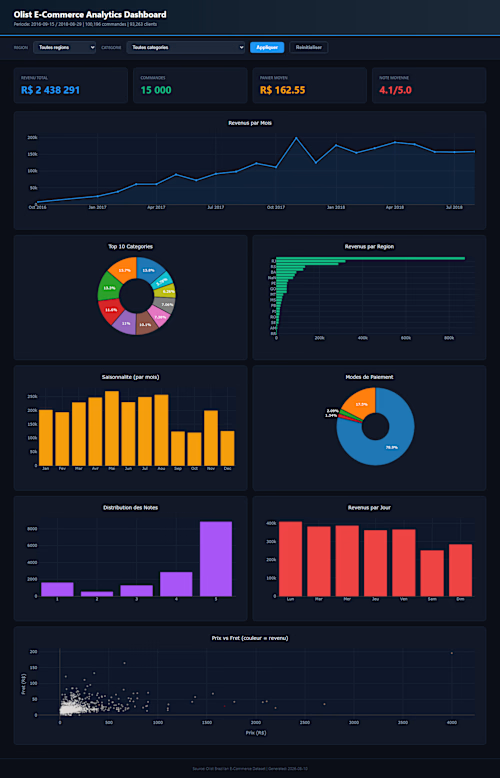
Interactive Visualizations: High-performance Plotly charts featuring zoom, hover tooltips, multi-series comparisons, and custom color themes aligned with your brand.
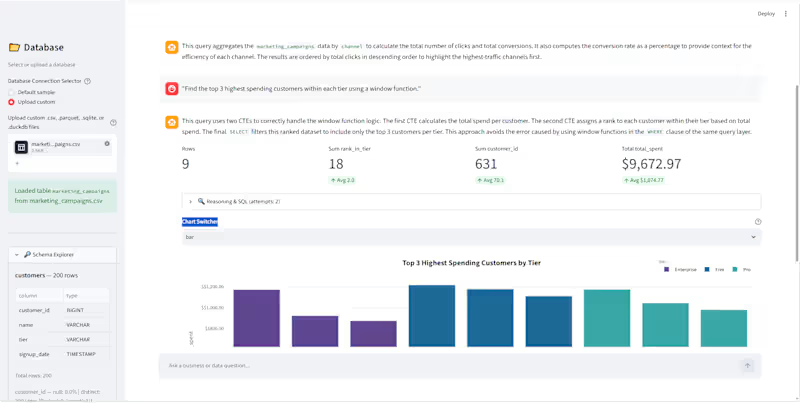
Data Source Connection: Seamless connection to CSV, Excel, PostgreSQL, MySQL, DuckDB, or Google Sheets.
Responsive Layout: Clean grid hierarchy with top-level KPI metric cards, comparative charts, and detailed data drill-down tables.
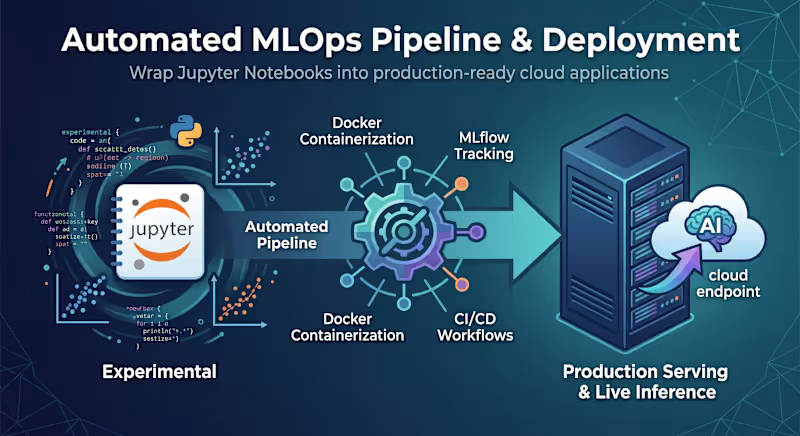
Turnkey Deployment: Deployed and accessible via a private or public web link (Streamlit Cloud, Hugging Face, or custom Docker container) with clean code and instructions.
How we work together:
Data & Goal Intake: You provide the dataset and outline the primary business decisions your dashboard needs to support.
Wireframe & Visual Build: I construct the data aggregation logic and build the interactive UI layout.
Feedback & Launch: You test the filters and charts, we apply any necessary adjustments, and I hand over the live application.
Example work
Starting at$500
Duration4 days
Tags
Dashboard, Data Visualization, Streamlit, Plotly, Business Intelligence
Service provided by
Mahdi Bettahar Bab Ezzouar, Algeria
- 1
- Followers
Interactive Dashboards & Custom BI Web AppsMahdi Bettahar
Starting at$500
Duration4 days
Tags
Dashboard, Data Visualization, Streamlit, Plotly, Business Intelligence
Transform static data into modern, responsive, and fully interactive web dashboards that empower your team to explore metrics on demand.
I build custom analytics web applications using Python, Plotly, and Streamlit or Dash. Instead of looking at flat spreadsheets or static PDF slides, your team gets intuitive dropdowns, date pickers, category filters, and clickable charts that update instantly in real time.
What you get with this service:
Dynamic Filtering & Controls: Filter by date ranges, sales regions, marketing channels, or user tiers with zero page-reload lag.
Interactive Visualizations: High-performance Plotly charts featuring zoom, hover tooltips, multi-series comparisons, and custom color themes aligned with your brand.
Data Source Connection: Seamless connection to CSV, Excel, PostgreSQL, MySQL, DuckDB, or Google Sheets.
Responsive Layout: Clean grid hierarchy with top-level KPI metric cards, comparative charts, and detailed data drill-down tables.
Turnkey Deployment: Deployed and accessible via a private or public web link (Streamlit Cloud, Hugging Face, or custom Docker container) with clean code and instructions.
How we work together:
Data & Goal Intake: You provide the dataset and outline the primary business decisions your dashboard needs to support.
Wireframe & Visual Build: I construct the data aggregation logic and build the interactive UI layout.
Feedback & Launch: You test the filters and charts, we apply any necessary adjustments, and I hand over the live application.
Example work
$500