
You will get Data Analysis in Excel, Power BI, python, and SQLIbrahim Nader
Do you need data-driven insights to make informed business decisions? I specialize in data analysis and visualization using Excel, Power BI, and Tableau to transform raw data into actionable insights with interactive dashboards and reports.
What's included
Data Cleaning & Preparation
Handling missing values, formatting, and organizing raw data.
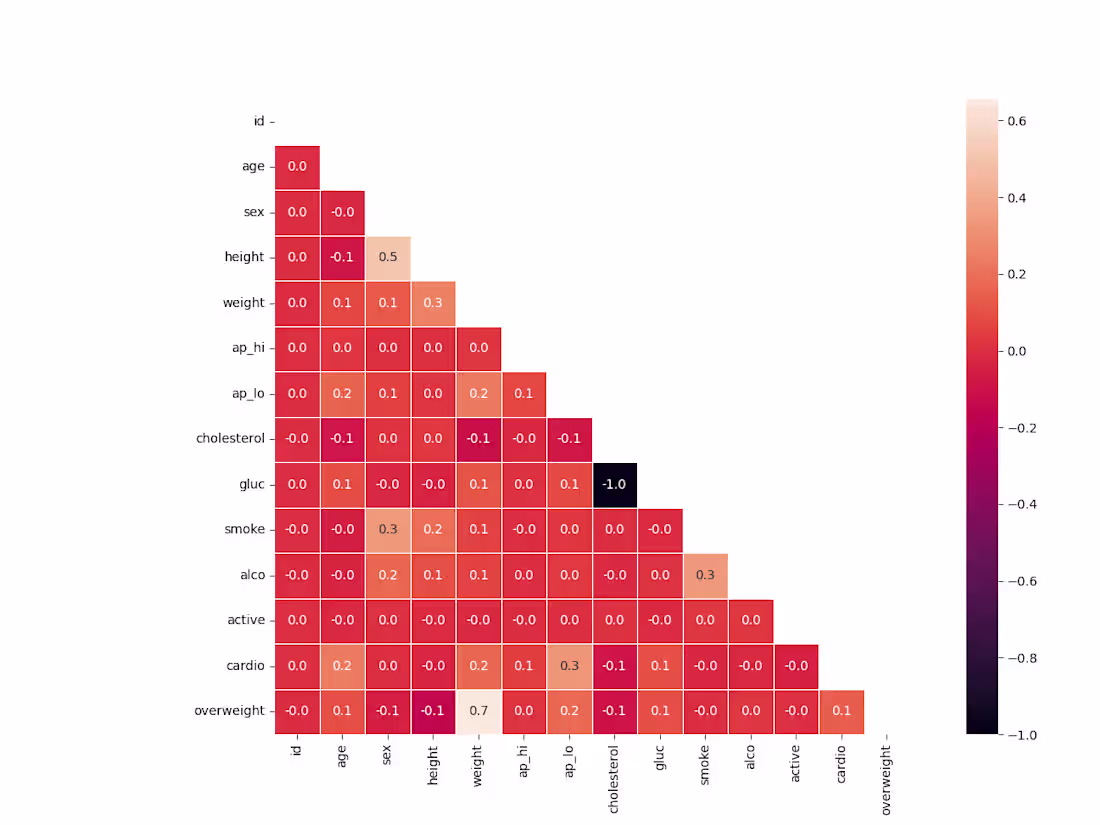
Exploratory Data Analysis (EDA)
Identifying trends, patterns, and key insights.
Custom Charts & Graphs
Professionally designed visuals for better storytelling.
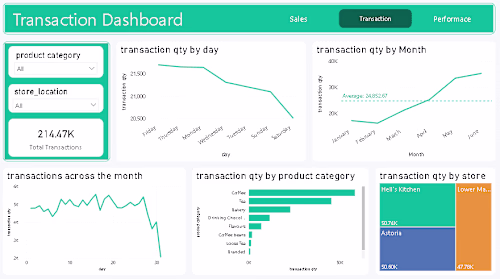
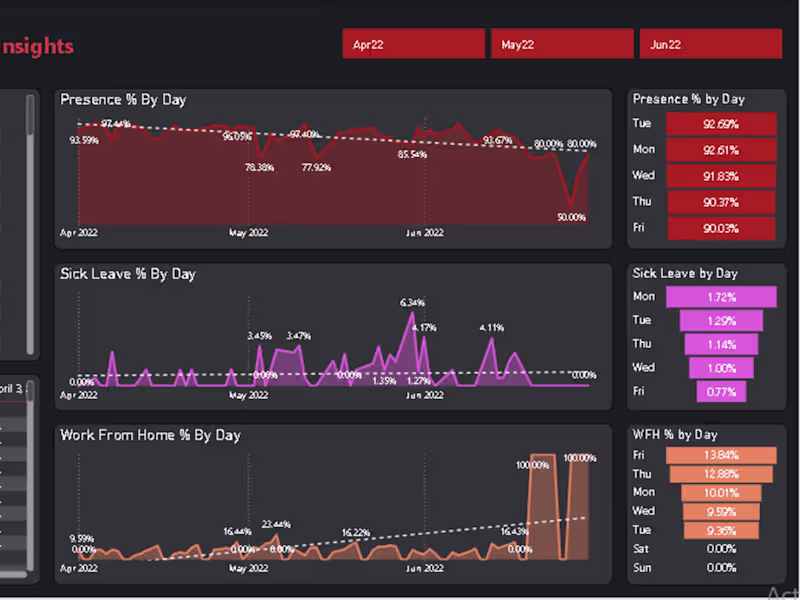
Example work
Ibrahim's other services
Contact for pricing
Tags
Microsoft Excel
Microsoft Power BI
Python
SQL
Data Analyst
Data Modelling Analyst
Data Scientist
Service provided by
Ibrahim Nader Cairo, Egypt
- 2
- Followers
You will get Data Analysis in Excel, Power BI, python, and SQLIbrahim Nader
Contact for pricing
Tags
Microsoft Excel
Microsoft Power BI
Python
SQL
Data Analyst
Data Modelling Analyst
Data Scientist
Do you need data-driven insights to make informed business decisions? I specialize in data analysis and visualization using Excel, Power BI, and Tableau to transform raw data into actionable insights with interactive dashboards and reports.
What's included
Data Cleaning & Preparation
Handling missing values, formatting, and organizing raw data.
Exploratory Data Analysis (EDA)
Identifying trends, patterns, and key insights.
Custom Charts & Graphs
Professionally designed visuals for better storytelling.
Example work
Ibrahim's other services
Contact for pricing