
Data AnalysisSai Thanishvi Daruru
I provide comprehensive data analysis services, leveraging advanced analytical techniques to extract actionable insights from complex datasets. What sets me apart is my ability to tailor analytical approaches to meet specific business needs, delivering insightful solutions that drive informed decision-making and maximize value for clients.
What's included
Data Analysis Report
A comprehensive document summarizing the findings, insights, and recommendations derived from the analysis.
Data Cleaning and Preprocessing Scripts
Code/scripts detailing the steps taken to clean, preprocess, and transform the raw data for analysis.
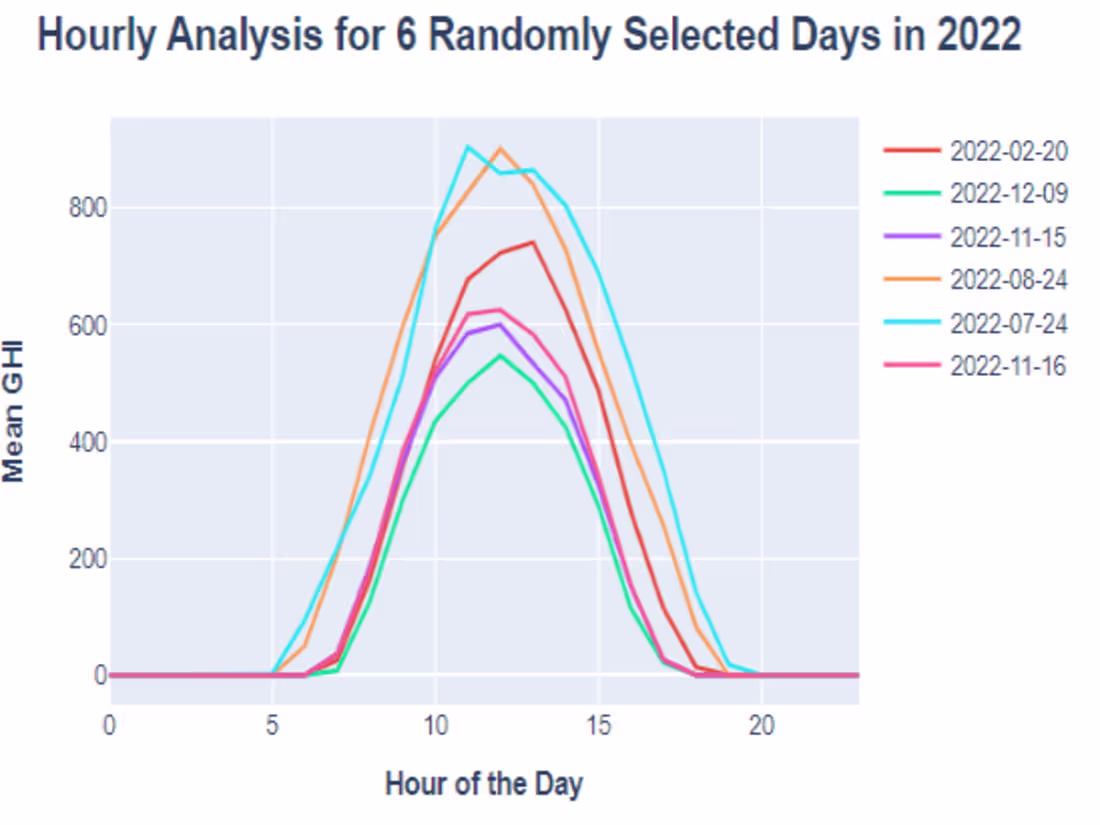
Visualizations
Graphs, charts, and dashboards presenting key insights and trends in the data for easy interpretation.
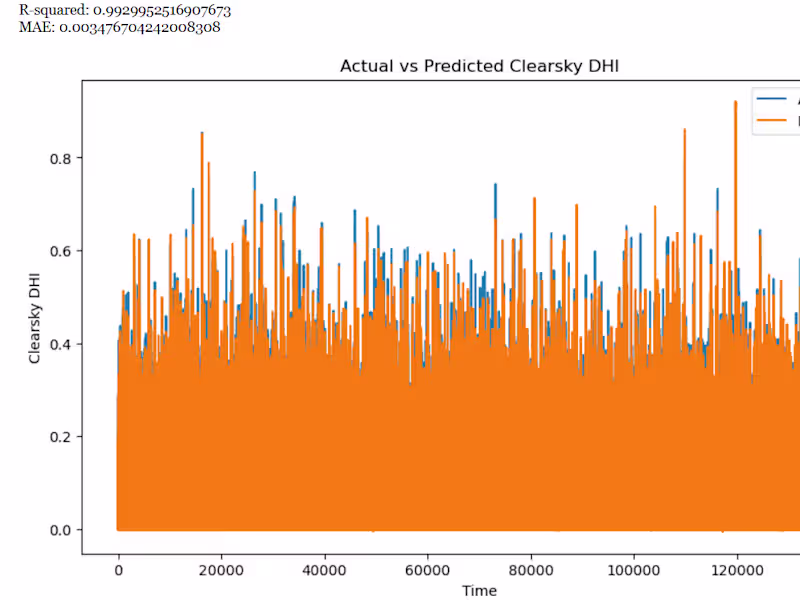
Statistical Analysis Results
Summary statistics, hypothesis testing outcomes, and any other statistical analyses performed on the data.
Documentation
Detailed documentation outlining the methodology, assumptions, limitations, and data sources used in the analysis.
Presentation or Demo
Client-facing presentation or demo showcasing the analysis process, key findings, and actionable insights for stakeholders.
Sai Thanishvi's other services
Starting at$1,000
Duration2 weeks
Tags
MATLAB
Microsoft Excel
pandas
Tableau
Data Analyst
Data Modelling Analyst
Data Scientist
Service provided by
Sai Thanishvi Daruru Boston, USA
Data AnalysisSai Thanishvi Daruru
Starting at$1,000
Duration2 weeks
Tags
MATLAB
Microsoft Excel
pandas
Tableau
Data Analyst
Data Modelling Analyst
Data Scientist
I provide comprehensive data analysis services, leveraging advanced analytical techniques to extract actionable insights from complex datasets. What sets me apart is my ability to tailor analytical approaches to meet specific business needs, delivering insightful solutions that drive informed decision-making and maximize value for clients.
What's included
Data Analysis Report
A comprehensive document summarizing the findings, insights, and recommendations derived from the analysis.
Data Cleaning and Preprocessing Scripts
Code/scripts detailing the steps taken to clean, preprocess, and transform the raw data for analysis.
Visualizations
Graphs, charts, and dashboards presenting key insights and trends in the data for easy interpretation.
Statistical Analysis Results
Summary statistics, hypothesis testing outcomes, and any other statistical analyses performed on the data.
Documentation
Detailed documentation outlining the methodology, assumptions, limitations, and data sources used in the analysis.
Presentation or Demo
Client-facing presentation or demo showcasing the analysis process, key findings, and actionable insights for stakeholders.
Sai Thanishvi's other services
$1,000