
Excel / Google Sheets KPI DashboardJoe Mack
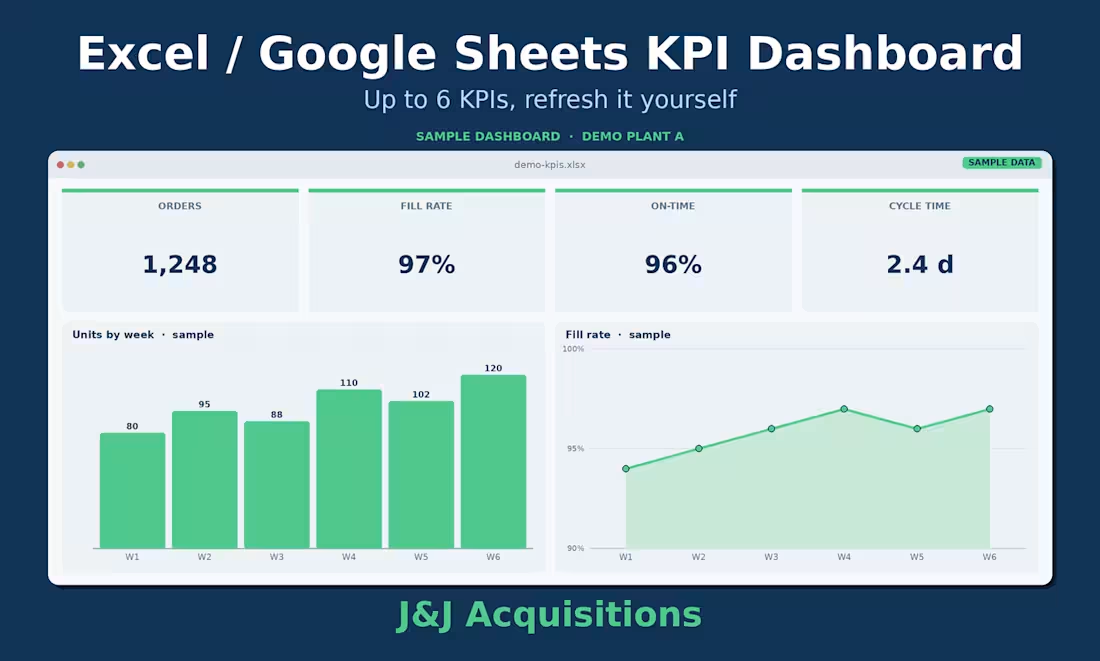
Turn your existing spreadsheet or CSV export into a one-page dashboard you can refresh yourself. You get up to 6 KPIs or charts (e.g. revenue by month, AR aging, job margin, occupancy), filters or slicers, a "paste new data here" tab so it updates without me, and a QA tab where three sample periods are checked against hand-calculated totals.
Scope: one data source (one sheet or CSV export), up to 6 KPIs or charts, one revision within 5 business days. Built in Excel or Google Sheets, your choice. Not included: live database connections, Power BI or Tableau, paid add-ons. Your source data is checked with our Verified Data Engine first. Your file is used only for this job and deleted after delivery and the revision window.
— Joe Mack, J&J Acquisitions


Excel / Google Sheets KPI DashboardJoe Mack
Starting at$349
Duration4 days
Tags
Microsoft Excel
Turn your existing spreadsheet or CSV export into a one-page dashboard you can refresh yourself. You get up to 6 KPIs or charts (e.g. revenue by month, AR aging, job margin, occupancy), filters or slicers, a "paste new data here" tab so it updates without me, and a QA tab where three sample periods are checked against hand-calculated totals.
Scope: one data source (one sheet or CSV export), up to 6 KPIs or charts, one revision within 5 business days. Built in Excel or Google Sheets, your choice. Not included: live database connections, Power BI or Tableau, paid add-ons. Your source data is checked with our Verified Data Engine first. Your file is used only for this job and deleted after delivery and the revision window.
— Joe Mack, J&J Acquisitions
$349